Hi, everyone. One of my favourite parts of any election night's coverage on CNN is 'the big board', specifically when John King goes through a race's results and boldly proclaims "This is where the people are". Also, there is nothing quite like the drama of a statewide race in Missouri where the Republican is 5 or 6 points up, but you can see St. Louis is still out...
PART 2 HEREPART 3 HEREPART 4 HEREPART 5 HERE
PART 2 HEREPART 3 HEREPART 4 HEREPART 5 HERE
Also, please drop by visit for the guys at Stochastic Democacy It looks like I'll be doing some live-blogging over there during Election Night, and they're looking like having a really cool system for calling elections that any numbers buff should check out.
However, other than the basics of 'Democrats live more in cities', it's tough to really get a sense of how a race is going to unfold based on what's shown on TV, especially when an important race in the Senate, of which there are several, get fairly little attention in the wake of a Presidential call.
So, I decided to try and help out myself, and by posting this, other Daily Kos readers, by calculating, for every county in the country, a partisan voting index. Think of this as the same as a regular PVI, only at a county level, relative to the overall state result, rather than at the CD-level relative to the overall national result. To do this, I took the results for the Democratic candidate in each county for the last two presidential races and the last two senate races and calculated by how much they differed from the overall state result for the Democrat in the same race.
For example:
2006 VA Senate - Statewide, Webb 49.6% - Rappahannock County, Webb 51.6%, for a rating of +2.0%
By averaging the results from these four races, weighting for the more recent, and weighting the Presidential race over the Senate races a little, I calculated each county's Blarghman County Voting Index (BCVI).
What does this mean, you ask? Well, bascially, what it means is that as results come in, you can look at the BCVI values, or more appropriately, the maps I have created that show them, and figure out if the results yet to come favour the Democrat or the Republican. Also, they can give you an early idea of how a candidate is doing.
As in the example above, consider, Rappahannock County, VA. While it was 2 points more for Webb than the state overall, when the other races are factored in, it is about even with the state average. This is reflected in the fact that John Kerry earned 45.4% in the county, and 45.5% in the state.
So, if Rappahannock reports fairly early on Election Night (purely speculation on my part), and Obama is above 50%, it's a very good sign that he will have a good chance at winning the state. To me, this is fascinating stuff, and can really give a lot of input to avid political viewers like myself and many others here.
So, with just a little further ado, I am going to present some maps, along with some brief discussion, of the first 10 states alphabetically, with the maps shaded by BCVI value.
**IMPORTANT NOTES ABOUT MAPS AND ANALYSIS**
- Remember that these are a voting index, not a vote total. The maps depict how far from a STATE AVERAGE a Democrat is expected to be in a given county.
- These are based on data from past elections, and do not consider changes in turnout pattern in this election, nor demographic shifts since the last election. I don't see any way to realistically model these, so I must unfortunately ignore them.
- The number on each county represents it's percentage of overall state 2004 turnout, to give you a rough idea of, as John King puts it, "Where the people are".
- I don't live in any of these counties, and I never have, I'm a Canadian citizen, who is fascinated with the mathematics, statistics, polling, drama and scope of US elections. So if you have something you know about your area that I've mischaracterized, please let me and others know in the comments, and I'll try and fix it.
- Note, unsurprisingly, the deeper red indicate more Republican areas, with the deepest red indicating a Index value lower than -20. The same is true for deepest blue and Democratic counties above +20. White indicates counties that are plus or minus 2.5 from the state average.
- To see a map bigger, including the numbers at much higher quality, at least in Firefox, right click and select 'View Image'. For IE, I think you have to choose 'Save Image', then view it once you've downloaded it.
- No maps for Alaska or Hawaii, I'm afraid. I only have statewide results for Alaska, and Hawaii's results don't really fit on a map with small islands.
- Really, this is #1 again, but you can basically consider these maps as a 50-50 scenario, ie. "what if the Democrat and the Republican tied in state X?". For some blood-red and ocean-blue (what else is deep blue, anyone got anything?) states, these will look strange, if only because we aren't used to seeing maps where a Democrat is anywhere near 50% in, say, Idaho.
So, finally, without any further ado, here we go, with Alabama.
ALABAMA
This page includes a map of county names

Races (538 Average/SSP Rating): President - Safe McCain (O 38.5, M 60.7) Senate - Safe Republican (D 33.4, R 64.5) House - AL-02, Bright v. Love (Lean R), AL-03 Segall v. Rogers(i) (Likely R), AL-05 Griffith v. Parker (Lean D)
Alright, so if there was any confusion about these being state average maps, it should be gone, because this should not look like any state map of Alabama you've seen recently. However, if you look at a map of the 5-point race in the 1990 governor's election, the red and blue match up quite nicely (see US Election Atlas for older result maps), which is good validation, considering the 1990 data is nowhere in this model.
The most striking feature, is, of course, the Black Belt right across the centre of the state. These dark blue counties, along with Montgomery County (the lighter blue patch with 4.76% in the belt), were the only counties Kerry carried, and many he did with more than 2/3 of the vote, including one of the strongest Democratic counties in the nation, Macon County (0.5% northeast of Montgomery County), which voted 83-17 for Kerry.
Other than this, note that the lightest blue and white counties are counties that went to Bush by 10 points, so it is an uphill climb for any Democrat in the state.
Counties to watch: Tuscaloosa County, white with 1.51% in the northeastern part. This is not a county that Obama or Senate candidate Vivian Figures will win, but it can give us an insight into African-American turnout. This is a 30% A-A county that gives around 35-40% of it's vote to the Democrat in most races. If either Democratic candidate is around the 45% mark, the state will be closer than expected. The AL-05 race stretches across the northern counties of the state, and has no really Republican areas. The AL-03 race is in the eastern counties, inculding the tail end of the Black Belt and a large part of Montgomery, which Segall will need. AL-02 is in the south east, but curls nearly all the way around Montgomery, and two Republican counties, Autaga and Elmore, will not necessarily be kind to Bobby Bright.
Where the people are: The two main areas of votes are in the south east 'tail', around Mobile, and in the north centre of the state, surrounding Birmingham.
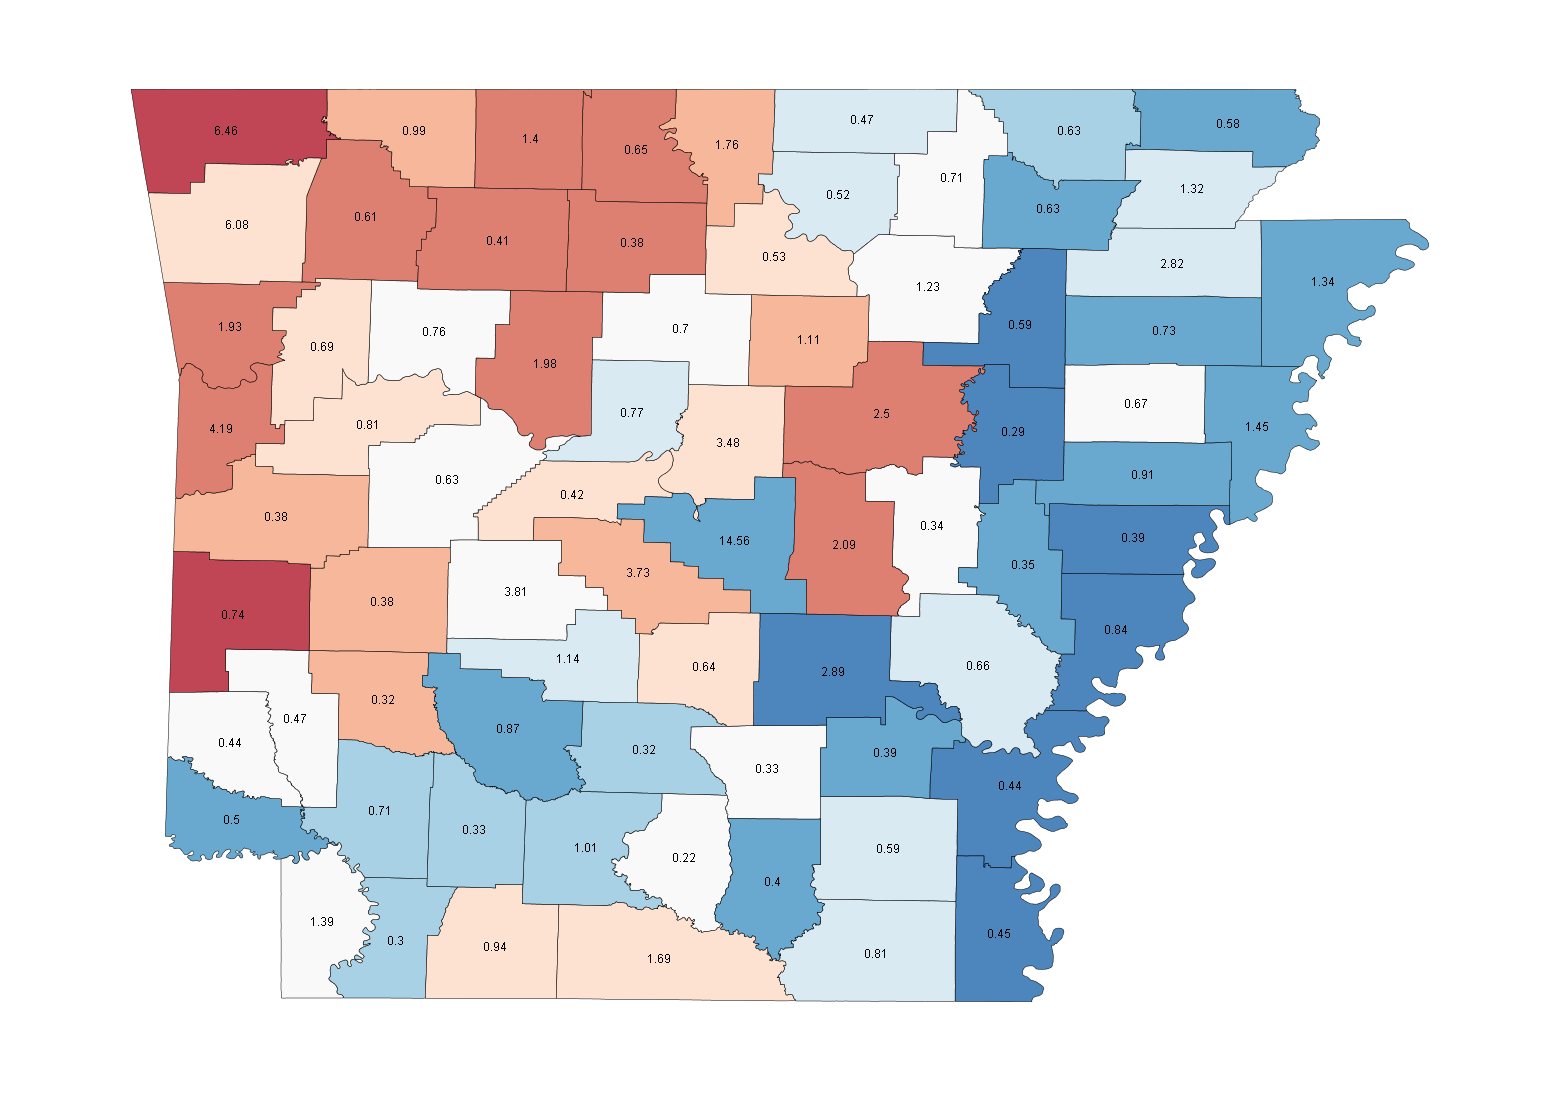
ARKANSAS
This page includes a map of county names
Races (538 Average/SSP Rating): President - Safe McCain (O 43.6, M 55.5) Senate - Safe Democrat (no Republican) House - No close races
A snoozer. A Clinton nomination would have made this one interesting, but with Obama there likely will not be a close race at the federal level. This is a split-personality state, one of several, that elects state-wide Democrats (2 senators and 3/4 House members), but federally is reliably Republican. Still, at the state-wide level there is still a clear schism along a diagonal line going southwest. In a close race, like the 2002 Gubernatorial race (see US Election Atlas), it wouldn't be surprising to see a Democrat sweep the entire eastern edge of the state. However, the strength of Republicans in the northwest and central parts of the state, including the 2nd and 3rd largest counties in the state, Benton and Washington, right in the northwest corner, negates the Democratic strength in the east.
Given that this is still a Southern state, we shouldn't be demographically surprised to find that the westernmost counties are heavily African-American, with several of the strongest being majority-minority counties. These include the strongest in the state, Pulaski and Lee.
In Arkansas, the lightest counties are often carried by a Republican by 10 points in a presidential election, and a Democrat by similar margins in state-wide races.
County to watch: Garland County (labeled with 3.81). In the centre-east of the State, Garland is just west of Little Rock. It typically goes for the winner by about the state-wide margin, ~7 points in 2000, ~10 points in 2004. It will tell you what kind of night Obama will have in the Natural State.
Where the people are: Unlike some states, the people are not where the strongest Democratic areas are. Instead, the two largest concentrations are around Little Rock in the centre of the state, with more than 1/3 of voters living in 10 counties around and in the state capital region. The other area is in the Republican north-east, with another 1/3 of people living on the western border.
ARIZONA
This page includes a map of county names

Races (538 Average/SSP Rating): President - Safe McCain (O 44.6, M 52.9) Senate - None House - AZ-01, Kirkpatrick v. Hay (Likely D), AZ-03, Lord v. Shadegg(i) (Likely R), AZ-05, Mitchell(i) v. Schweikert (Lean D), AZ-08, Giffords(i) v. Bee (Likely D)
Obviously, no state polls have made the headlines bigger than Obama's closing on McCain in the Republican's home state, and it was a line from one of these that really pointed out an important fact you can see on these maps.
From a recent poll by Zimmerman % Associates, M 44, O 42
Maricopa County voters preferred McCain by a thin edge of 42.9% to 40.0% for Obama, while Obama enjoys a margin of almost 19 points in Pima County, beating McCain 53.5% to 34.9%. Arizona's other 13 counties, combined, give McCain a 51.8% to 37.3% advantage.
County to watch: An important thing to realize about Arizona is that while Maricopa County is a huge influence on the state, with nearly 60% of the voters, a Democrat can win the state without winning Maricopa, though only barely, as Janet Napolitano did in her 2002 Gubernatorial election. Maricopa typically favours the Republican by 1 or two points, so a tie or a 1 point loss could be a very close statewide Democratic win. By the same respect, if Obama is behind by more than a couple here, McCain will hold his home state.
Pima County, mentioned above, is the larger blue county on the southern border, with 20% of the voters, a state that the Democrat generally picks up around 52-53% in. the real key in the poll mentioned above is not Obama's number in the county, which is not remarkable, but McCain's which is very low. If undecideds break for Obama, he will at the very least outperform Bush. The dark blue county in the east is Apache, typically a 65-35 democratic county. This is a 77% Native American county (a voting bloc as Democratically loyal as African-Americans), with nearly 60% speaking Navajo in their homes. The size of the margins and size of the turnout in Apache County will be an interesting measure of Obama's ability to reach out and inspire aboriginal voters.
The open seat in AZ-01 will also benefit from any turnout increase, as it includes Apache County, but the majority of the population is in the western part of the district, surrounding the northern and eastern parts of Maricopa County. The key areas for the Democrat are obviously getting good numbers in the blue counties, but also to maximize results in the part of swing Pinal county southeast of Maricopa. AZ-03, with O2B candidate Bob Lord and AZ-05 are both within Maricopa County itself. Gabrielle Giffords in AZ-08 is in the Southeast corner, getting only parts of blue counties Pima and Santa Cruz, but this may be enough to lift her over the top.
Where the people are: Maricopa, with nearly 60% of voters, including the Phoenix area.
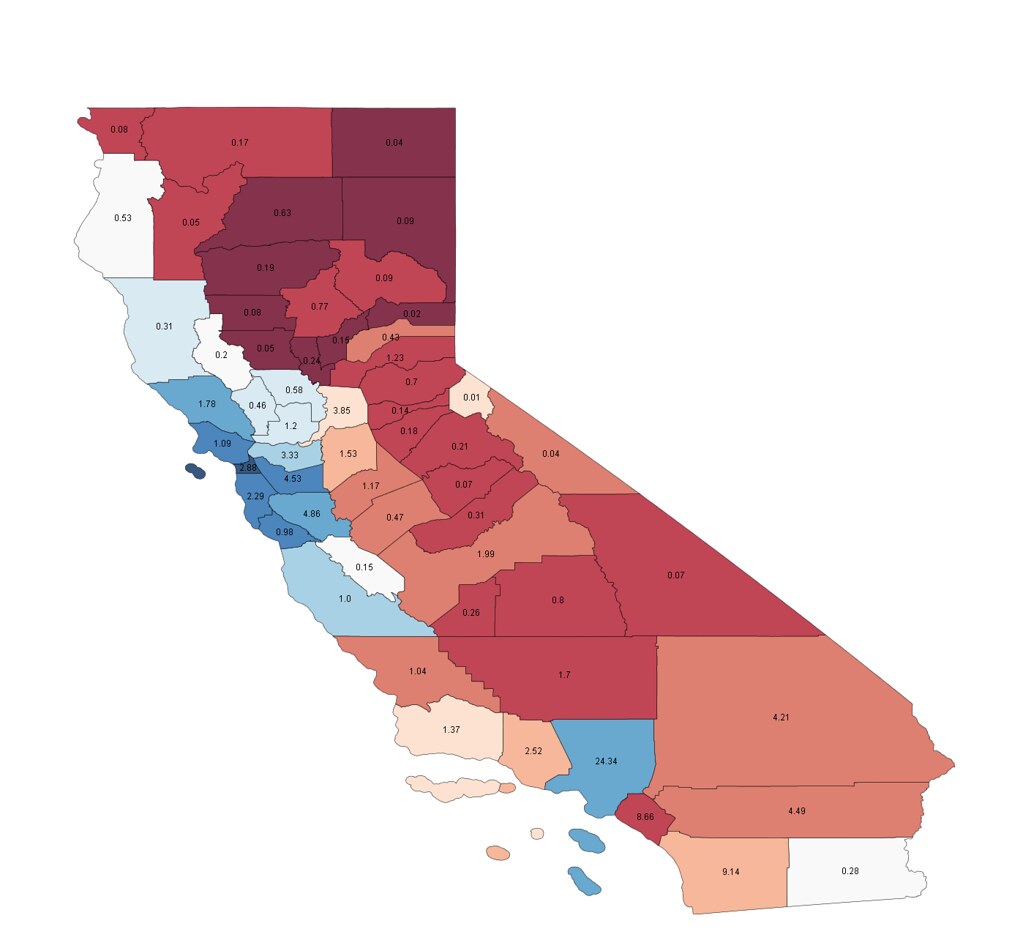
CALIFORNIA
This page includes a map of county names
Races (538 Average/SSP Rating): President - Safe Obama (O 58.7, M 39.4) Senate - None House - CA-04, Brown v. McClintock (Tossup), CA-11 McNerney(i) v. Andal (Lean D), CA-46, Cook v. Rohrabacher(i) (Likely R), CA-50, Leibham v. Bilbray(i) (Likely R)
Ah our first true blue state. Not too blue looking, though. Here's where it's key to look at the large image with readable numbers, because while the deep red areas, where Democrats rarely crack 40%, are large geographically, they are tiny in terms of population. All of the deep red and brick red counties in the northern part of the state, up until the western border begins to angle, are combined around the size of Democratic stronghold San Francisco. The key is that in a tight race, like the 2002 Gubernatorial election, a Democrat can win without winning a county further inland than Napa (the light blue 0.58 in the north-central part of the state).
However, this won't be a problem for Obama, who could conceivably sweep all but two or three coastal counties and make inland gains as well, especially in the south. Obviously, Proposition 8 is the other big battle here, and looking at the polling, an interesting, but unsurprising trend develops. While whites, Independents and REpubclians have about the same percentage for Obama and No, Blacks and Hispanics are basically split on the measure, and, ironically, turnout increases, especially in a mostly-minority area like Los Angeles, may boost Obama's number and save the Mormon agenda.
County to watch: Imperial County, the white spot at the extreme southeast of California, is an interesting one to gauge the effect of the Latino vote. 72% in this county are Latino, and 66% speak Spanish as their first language, and while Obama will win it, it is not a major Democratic stronghold. If, as polls suggest, both California is an Obama romp and Hispanics move towards the Democrats, Obama could win this by as much as 25 points, where Kerry won by only 6.
O2B candidate Charlie Brown is a good man (Sorry), but is running in a tough district, as CA-04 covers the northwest of the state, stretching in a thin column down to El Dorado county (the red 0.7 right at the 'elbow' of the state'. To win, Brown will have to build large margins in the south, as the northern areas are quite inhospitable to Democrats. The good news is that most of the people live in the southern part of the district.
**cranberrylib and MelKnee give me a chance to remind everyone of a couple of caveats as they make a solid case for CA-02, where voter registration has tipped to the democratic side in many of the blood red counties (CA-02 is in a similar area to CA-04, but more centrally located). These are only based on statewide results, and the most recent data is from two years ago. Change like this be reflected in maps made after Tuesday. Also, it's important to note that these blood-red counties might have Democrqats, just at a lower proportion than California as a whole. In Idaho, for example, they'd be white or just barely red. So this leaves a chance for change like what's happeining in CA-02, where Dem Jeff Morris takes on Republican Wally Herger
Where the people are: Los Angeles, which I didn't even mention, has almost a quarter of the state's vote, and typically sends around 2/3 of that to the Democrat. It is on the power of LA voters that Democrats can absorb losses in many other parts of the state. Also, watch the Prop 8 number here, as this is where it will live or die, I suspect.
COLORADO
This page includes a map of county names

Races (538 Average/SSP Rating): President - Likely Obama (O 52.4, M 46.4) Senate - Safe Democrat (D 53.1, R 43.8) House - CO-04, Markey v. Musgrave(i) (Tossup)
Not the prettiest map, a fair jumble, with Democrats sort of like the path of a drunk guy, as he walks south, lurching first to the west, then back to the east. The darkest of the dark red are mostly small, but the brick red areas just south of Denver (Denver is the blue 'squiggle'), are the really tough areas, Douglas and El Paso counties, large and very red, including Colorado Springs. The deepest blue is Costilla County, a heavily Hispanic area, along with the areas of Denver and Boulder Counties, which represent both cities proper, along with the University of Colorado. It'll be also interesting to note whether Obama's relative increase with Hispanic voters that seems clear in national polls will push some of the pale blue or white areas in the southern part of the state to an even deeper shade.
Counties to watch: It has to be counties, as there are four huge ones of interest that will give you a very good idea of how Obama (and Udall, though it likely won't be close for him) are doing. These are the four white counties surrounding the darker blue Denver and Boulder areas in the north. Broomfield, Larimer, Jefferson and Arapahoe county. They combine to have nearly 30% of the state's votes, and while Larimer is typically a point or so more Republican than the state, the others generally are good bellwethers. If Obama is posting even 55% in these counties, he will likely have enough to win the state.
In CO-04, Betsy Markey has a real chance, despite having a pretty red coloured district. CO-04 is basically an L-shape around the northwest corner of the state, but Markey's hope lies in the fact that the district is primarily centered around the lighter coloured Larimer and Weld counties in the north. Winning these areas strongly will be key for her.
Where the people are: Right in the centre of the state. Denver, Boulder, Colorado Springs and the counties that connect the three in a straight line contain more than 50% of the state's votes.
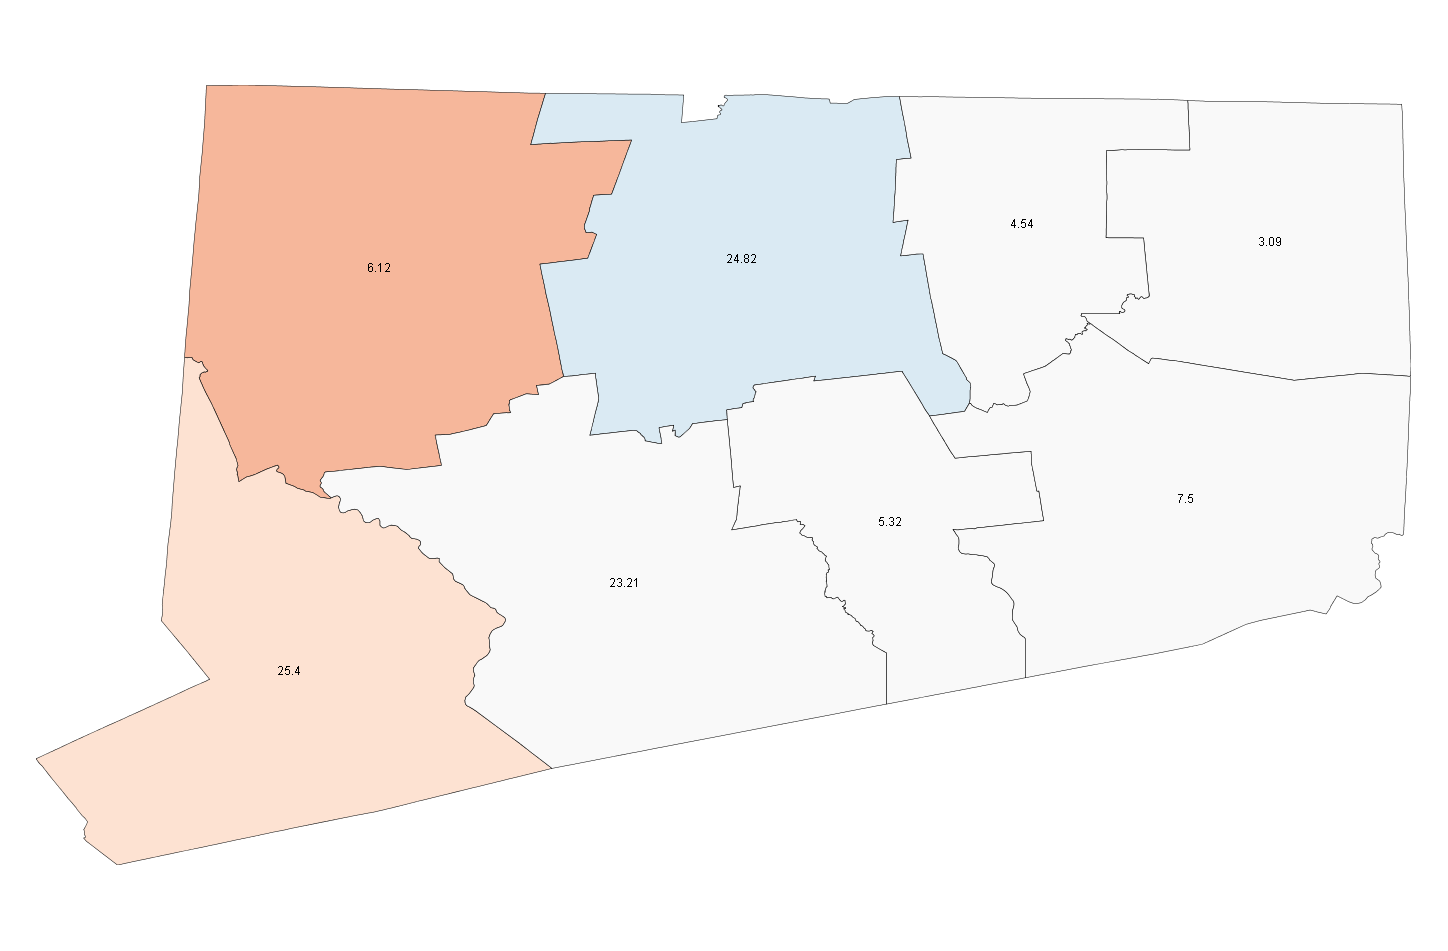
CONNECTICUT
This page includes a map of county names
Races (538 Average/SSP Rating): President - Safe Obama (O 58.5, M 39.2) Senate - None House - CT-04, Himes v. Shays(i) (Tossup), CT-05 Murphy(i) v. Cappiello
Sorry, Northeast, but you're just generally not as interesting as the South, West or Midwest. Especially the smaller states with fewer counties, where there just isn't much variation. If McCain wins a county, it will be Litchfield in the northeast corner, but that's the main statewide drama to watch. The only blue county is Hartford, and this was Ned Lamont's strongest support against the Connecticut for Benedict Arnold party.
County to watch: For the state-wide race, the county to watch is probably Windham in the far northeast, as it will likely let you know if Obama wins by 15, 20 or 25. The two house races are cover areas that are more red, with the top-tier race in CT-04 mostly in the southwestern Fairfield County. Given Obama could win this by 10 or 15 points, compared to Kerry's 4 point margin, O2B candidate Jim Himes will have a good shot.
Where the people are: Three counties, blue Hartford, red Fairfield and white New Haven that lies between the other two have more than 75% of the votes.
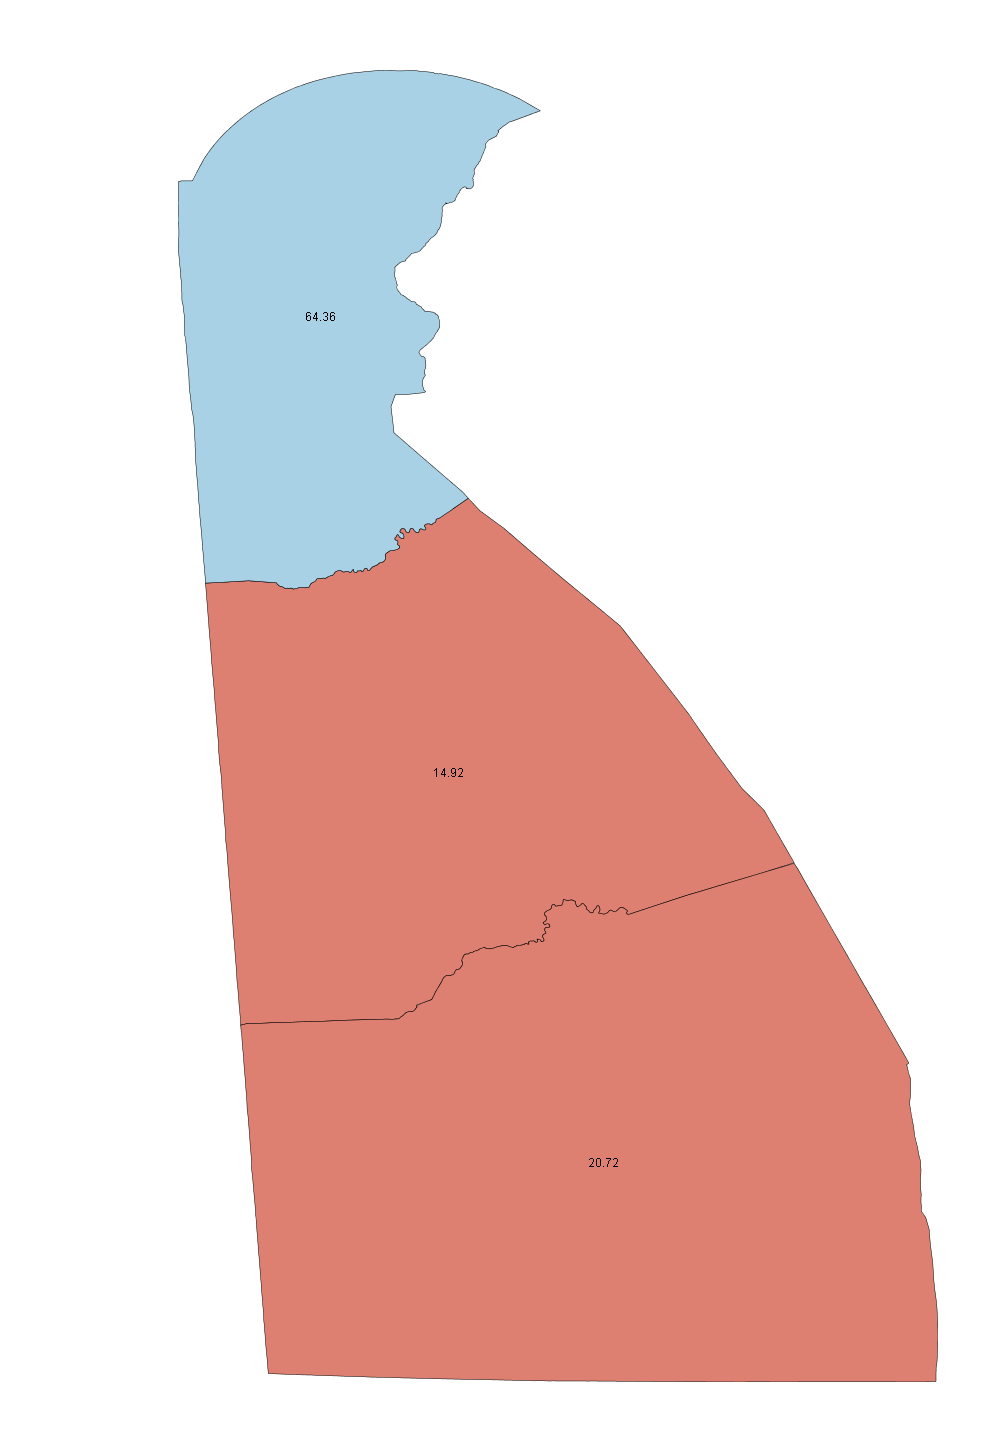
DELAWARE
This page includes a map of county names
Races (538 Average/SSP Rating): President - Safe Obama (O 58.8, M 40.2) Senate - Safe Democrat (D 68.2, R 29.2) Governor - Safe Democrat House - No close races
Given the over-division of some states with huge numbers of counties (I'm looking at you, Mr. "I have 30 more counties than California" Nebraska), it's nice to see such a easy division as Delaware. Not too interesting though. Both Gore and Kerry won Delaware, but carried only a single county, New Castle in the north. Even Biden lost the central county, Kent, in his last re-election bid. However, with things set for an Obama-Biden landslide, will Democrats claim all three counties for the first time since Clinton?
County to watch: The sticking point to winning all the counties might be Sussex in the south, which barely went to Biden, and went to Bush 39-60.
Where the people are: Nearly 2/3 of voters are in northern New Castle County, which includes Wilmington.
FLORIDA
This page includes a map of county names
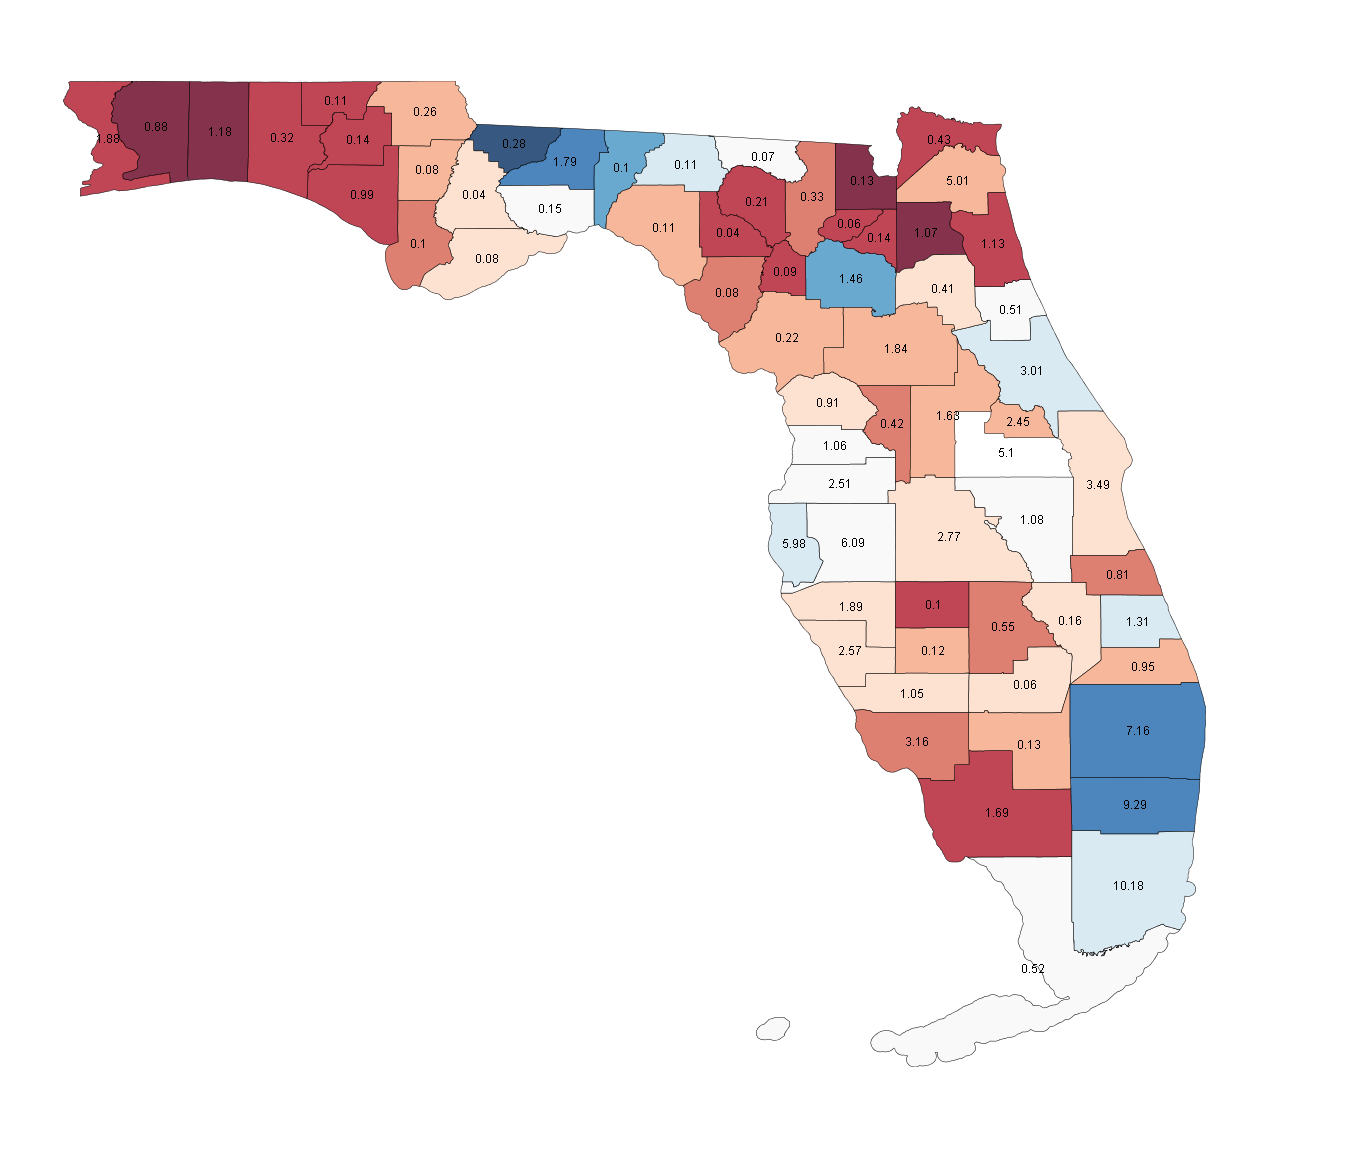
Races (538 Average/SSP Rating): President - Lean Obama (O 50.7, M 48.2) Senate - None House - FL-08 Grayson v. Keller(i) (Tossup), FL-13 Jennings v. Buchanan(i) (Likely R), FL-18 Taddeo v. Ros-Lehtinen(i) (Likely R), FL-21 Martinez v. L. Diaz-Balart(i) (Tossup), FL-24, Kosmas v. Feeney(i) (Lean D), FL-25 Garcia v. M. Diaz-Balart(i) (Tossup)
Sigh. Just when I thought I was going to finish shortly, I get hit with this. Still, I suspect there might be a couple of people who might know something about presidential politics at the level of Florida counties. The three main counties involved in the 2000 controversy over Bush v. Gore, are, unsurprisingly, blue, as Miami-Dade, Broward and Palm Beach make up the southwestern blue block bordering the Atlantic Ocean. Both Broward and Palm Beach deliver around 60% to Democrats, while Miami-Dade favours Democrats by a few points, though shifts in the Cuban-American community prominent in Miami could benefit Obama, as it seems to be helping Democratic House candidates in the area. The other dark blue county in the far north of the state is part of the 'Black Belt' we talked about in Alabama, the highest-proportion African-American county in the state. Tallahasse, home to FSU and Florida A&M, is the other nearby Democratic county in the north.
Republicans are strong around Jacksonville in the north east, specifically Clay county, which went to Bush 76-23. They also are strong in the Panhandle, including Pensecola in the far west, and in the Southeast, namely Fort Myers. Collier county, in the general vicinity of Fort Myers, is the only large brick-red county south of the Jacksonville area.
Counties to watch: If you didn't get enough four years ago, Miami-Dade will be critical, as a split between Cuban-Americans and the Republican Party could boost Democratic chances in the district.
The real key to seeing who will win the state may lay in the east, the three white and one pale-blue county surrounding the Tampa and St. Petersburg area. Overall, these might lean towards a democratic angle, but they will all be close enough to the state average that they can serve as bellwethers. If Obama is tied in Pinellas county, the easternmost, and losing the others, it could be a long night. If he is dead even in the westernmost three, Hillsborough, Pasco and Hernando, it could be Bush v. Gore. If he is winning, he can carry the state.
The other area to watch is the white counties to the west, Orange and Osceola, in the Orlando area. These were both Gore counties, but just barely. A margin of 5 points in these areas might mean a margin of 4-5 points statewide. Most of the house races are in the Miami-area, but FL-13 is just south of Tampa, in the pale red counties there, with Sarasota and Mantee playing a major role. FL-08 is just north of the Orlando area, straddling the edge of Orange county and moving northwest through pale-red territory. FL-18 and FL-25 feature O2B candidates, Annette Taddeo and Joe Garcia
Where the people are: Mostly mentioned already, but more than a third of voters are in the disputed Bush v. Gore counties around Miami, and another quarter or so lie around Tampa.
GEORGIA
This page includes a map of county names
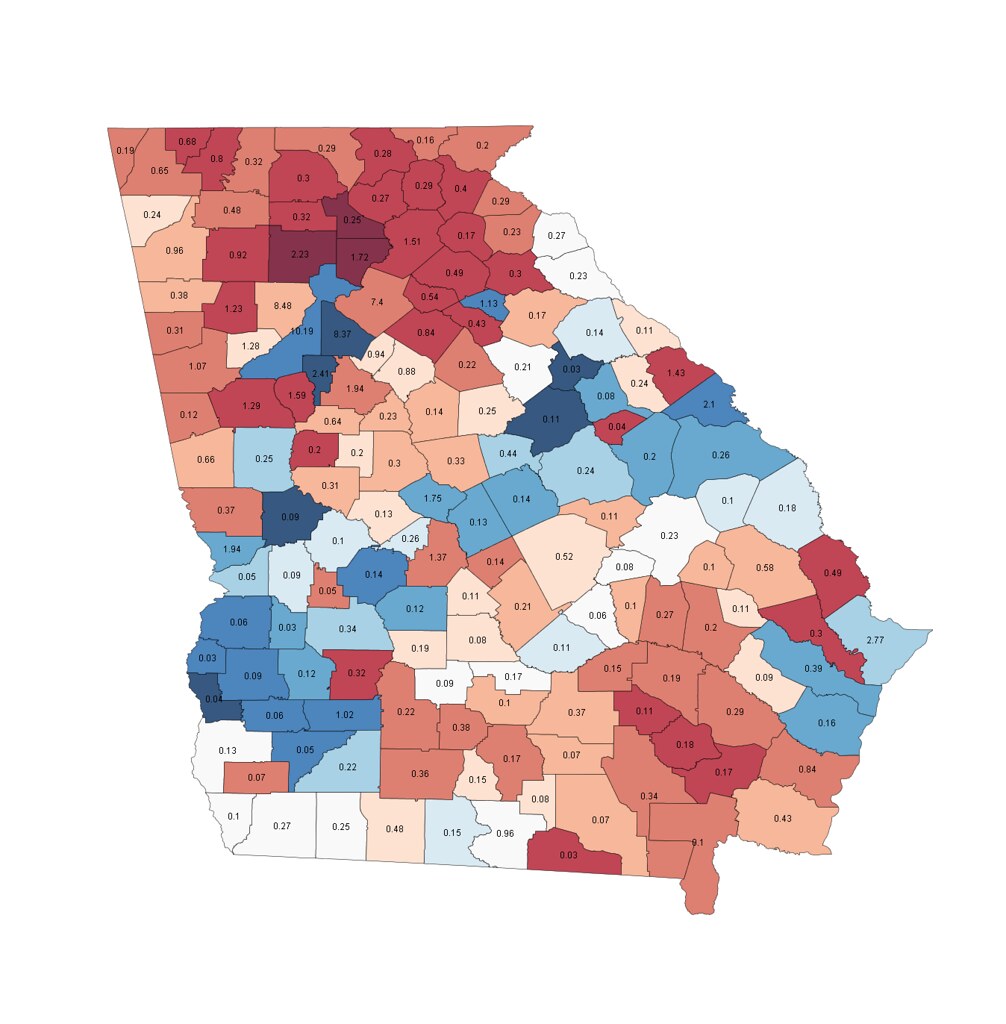
Races (538 Average/SSP Rating): President - Likely McCain (O 47.0, M 52.0) Senate - Lean Republican (D 47.0, R 50.2) House - GA-08 Marshall(i) v. Goddard (Lean D)
You can see the 'Black Belt' yet again in this map, as it turns to the North and runs into the Carolinas. However, these counties are not as African-American as in Alabama, and generally deliver 60% to the democrat, rather than the near 70% that many in Alabama do. However, Democrats in Georgia make up for it significant strength in the Atlanta area, as DeKalb and Clayton counties, the two northeastern dark blue counties, are among the strongest in the state and the country, around 70% Democratic. Republicans are as usual strong in rural white areas, but also in the white northern suburbs of Atlanta, including Cherokee county, the deep red north of Atlanta, and Cobb county, the pale red just west of Fulton County, Atlanta.
Counties to watch: Georgia is a very polarized state, unlike Florida, which had large counties that were white-coloured, all of the largest counties in Georgia are either red or blue, leaving the bellwethers as smaller, less predictable counties. Three to watch are Lowndes, Greene and Baldwin.
Baldwin is pale blue in the middle of the state, with 0.44 written in it. It is a typically close district, but it runs about 5 points ahead of the Democratic candidate state-wide. This 43% African-American county must surely give Obama or O2B Senate candidate Jim Martin at least 55% to suggest a state-wide win.
Greene County is just north of Baldwin, a white county with a label of 0.21, and it typically votes 60-40 for the Republican. When Max Cleland lost to Saxby Chambliss by 7 points statewide, he lost by 12 in Greene. If Obama/Martin have a chance in the state, they need to get Greene county to be a near tie. For the corollary, if you see either ahead or close in Greene county, buckle up.
The third county, Lowndes, represents, what is the main swing region of the state, and another place to closely watch, the southeastern edge, bordering on the Florida panhandle. While these look much more tossup than the panhandle just did, that is partially because Georgia is on average more Republican, so the panhandle region looks more mainstream in Georgia than in Florida. Lowndes, which contains Valdosta, is typically 60-40 Republican in statewide races, and if either candidate manages to split these counties, as Zell Miller did in the '94 Governor's race, then the the Obama campaign and the Martin campaign may just pull it out.
The 8th district, where Jim Marshall is again fighting off a tough challenge, this time from a former Air Force general, is a large district in the centre of the state, beginning in the pale red areas just south of Atlanta, and stretching to the pale red areas just north of Lowndes county. The largest part of the district is Bibb County, which contains Macon.
Where the people are: The only counties with more than 2% of the state's votes lie in the Atlanta region, and four counties between them hold more than a third of the vote.
HAWAII
This page includes a map of county names
Sorry, Hawaiian fans, but my mapping software didn't look very good here, it couldn't seem to figure Hawaii out. I'll try an take another crack at it, but no maps for now, I'm afraid.
Races (538 Average/SSP Rating): President - Safe Obama (O 63.7, M 34.9) Senate - None House - No close races
The good thing considering there are no maps is there are no close races, as Hawaii should be safely Democratic. Honololu is generally a bit more Republican than the state average, with the big island, Kauai County and Maui County more Democratic.
County to watch: Honolulu being 'a bit Republican' this year might mean being at 60 percent to the state's 63, as islanders cast their votes for the hometown boy.
Where the people are: Nearly 70% of votes come from Honolulu. Just 147 people live in the isolated village of Kalawao on Moloka'i. Unfortunately, I don't have voting data, which I suspect is folded into the Maui data.
IDAHO
This page includes a map of county names

Races (538 Average/SSP Rating): President - Safe McCain (O 35.8, M 62.9) Senate - Safe Republican (D 39.8, R 56.7) House - ID-01 Minnick v. Sali(i) (Tossup)
Ok, so you'll notice something different about the Idaho map, mainly because the only competitve race is a house race, so I decided to have a map with the house districts overlayed. ID-01 is the Western district, where Walt Minnick takes on loser Bill Sali.
Still, it's strange to see an Idaho map with so much blue, but even this deeply red state had a Kerry county, the deep blue of Blaine, which has been Democratic since '92, and actually placed Bush the Elder third. However, it's worth noting that the palest red counties were generally 70-25 Bush counties. The palest. Ouch.
Counties to watch: Obama is polling 5 popints higher than Kerry with undecideds still left, though, so with a good showing he might be able to flip at least one other county, Shoshone, the easternmost blue county in the north, where Kerry lost by only 11 points.
The real keys to the race are of course for Minnick, though, and he will have to turn those blue counties in the panhandle (thanks, Idaho Guy)) into actual blue, not just relative blue, come election night. In this respect, the main county is Kootenai, the pale blue 9.12% county in the north. Nominally a 30-65 Republican county, Minnick will surely ahve to outright win it to win the seat, with the same being true of Boise to the south.
Where the people are: One main area and a couple of smaller areas. More than a third live around the pale blue in the southeast, the Boise area and environs. In the north, where Minnick must win, lies Coeur d'Alene, and another 15% of the population in that area. Finally, about 8% live in the southeast, where Pocatello is. The good news is that these areas are blue on this map, the bad news is they'll be red come election day, at least in the state-wide races.
One other quick note, the westernmost dark blue county in the panhandle is Latah County, whose seat is Moscow, Idaho, home to the University of Idaho, and former home to Sarah Palin. It would be nice for Obama to win that, but I'd take Minnick as the representative.
**Some great stuff from W Lane Startin reminds us that all of Idaho is turning blue, not just Minnick's district. Debbie Holmes in ID-02 may have a tough road against her, but the field has definitely improved in recent years. Some notes from W Lane Startin:
Teton County is growing very quickly and is becoming increasingly influenced by the liberal community in neighboring resort community of Jackson, Wyoming (home of Gary Trauner, among others). The statistics haven't really caught up with it, but over the past two years or so it's trended blue harder than any other Idaho county, hands down. It's in my top three list of counties likely to turn.
Bonner County is Sandpoint. While most of the panhandle has a relatively moderate voting history, it hasn't been real Democratic-friendly since the double whammy of the decline of the mining industry and "right to work." Sandpoint is also Sarah Palin's birthplace; she's actually a positive there.
Nez Perce County (Lewiston), on the other hand still has a fairly strong union presence. They also have a crackerjack county Democratic organization there. It's not a shoo-in, but it's well within reach.
He/she predicts more than the one or two flips I highlight... In addition to Blaine, watch Latah, Shoshone, Nez Perce, Valley, Teton, Bannock and Ada. All are within reach....
Great stuff from someone with some real local knowledge. Hopefully others will continue to contribute the same in later diaries.
So there's the first ten states. Thanks for reading, and please give suggestions, ideas, criticism and anything else in the comments, I love to chat and hear from people :)