Hi, everyone. One of my favourite parts of any election night's coverage on CNN is 'the big board', specifically when John King goes through a race's results and boldly proclaims "This is where the people are". Also, there is nothing quite like the drama of a statewide race in Missouri where the Republican is 5 or 6 points up, but you can see St. Louis is still out...
PART 1 HEREPART 2 HEREPART 3 HEREPART 4 HERE
**If you've read the other entries in this series, the introduction below is identical, so you can just skip to the maps**
PART 1 HEREPART 2 HEREPART 3 HEREPART 4 HERE
Also, please drop by visit for the guys at Stochastic Democracy It looks like I'll be doing some live-blogging over there during Election Night, and they're looking like having a really cool system for calling elections that any numbers buff should check out.
However, other than the basics of 'Democrats live more in cities', it's tough to really get a sense of how a race is going to unfold based on what's shown on TV, especially when an important race in the Senate, of which there are several, get fairly little attention in the wake of a Presidential call.
So, I decided to try and help out myself, and by posting this, other Daily Kos readers, by calculating, for every county in the country, a partisan voting index. Think of this as the same as a regular PVI, only at a county level, relative to the overall state result, rather than at the CD-level relative to the overall national result. To do this, I took the results for the Democratic candidate in each county for the last two presidential races and the last two senate races and calculated by how much they differed from the overall state result for the Democrat in the same race.
For example:
2006 VA Senate - Statewide, Webb 49.6% - Rappahannock County, Webb 51.6%, for a rating of +2.0%
By averaging the results from these four races, weighting for the more recent, and weighting the Presidential race over the Senate races a little, I calculated each county's Blarghman County Voting Index (BCVI).
What does this mean, you ask? Well, basically, what it means is that as results come in, you can look at the BCVI values, or more appropriately, the maps I have created that show them, and figure out if the results yet to come favour the Democrat or the Republican. Also, they can give you an early idea of how a candidate is doing.
As in the example above, consider, Rappahannock County, VA. While it was 2 points more for Webb than the state overall, when the other races are factored in, it is about even with the state average. This is reflected in the fact that John Kerry earned 45.4% in the county, and 45.5% in the state.
So, if Rappahannock reports fairly early on Election Night (purely speculation on my part), and Obama is above 50%, it's a very good sign that he will have a good chance at winning the state. To me, this is fascinating stuff, and can really give a lot of input to avid political viewers like myself and many others here.
So, with just a little further ado, I am going to present some maps, along with some brief discussion, of the first 10 states alphabetically, with the maps shaded by BCVI value.
**IMPORTANT NOTES ABOUT MAPS AND ANALYSIS**
- Remember that these are a voting index, not a vote total. The maps depict how far from a STATE AVERAGE a Democrat is expected to be in a given county.
- These are based on data from past elections, and do not consider changes in turnout pattern in this election, nor demographic shifts since the last election. I don't see any way to realistically model these, so I must unfortunately ignore them.
- The number on each county represents it's percentage of overall state 2004 turnout, to give you a rough idea of, as John King puts it, "Where the people are".
- I don't live in any of these counties, and I never have, I'm a Canadian citizen, who is fascinated with the mathematics, statistics, polling, drama and scope of US elections. So if you have something you know about your area that I've mischaracterized, please let me and others know in the comments, and I'll try and fix it.
- Note, unsurprisingly, the deeper red indicate more Republican areas, with the deepest red indicating a Index value lower than -20. The same is true for deepest blue and Democratic counties above +20. White indicates counties that are plus or minus 2.5 from the state average.
- To see a map bigger, including the numbers at much higher quality, at least in Firefox, right click and select 'View Image'. For IE, I think you have to choose 'Save Image', then view it once you've downloaded it.
- Really, this is #1 again, but you can basically consider these maps as a 50-50 scenario, ie. "what if the Democrat and the Republican tied in state X?". For some blood-red and ocean-blue (what else is deep blue, anyone got anything?) states, these will look strange, if only because we aren't used to seeing maps where a Democrat is anywhere near 50% in, say, Idaho.
Onwards and forwards.
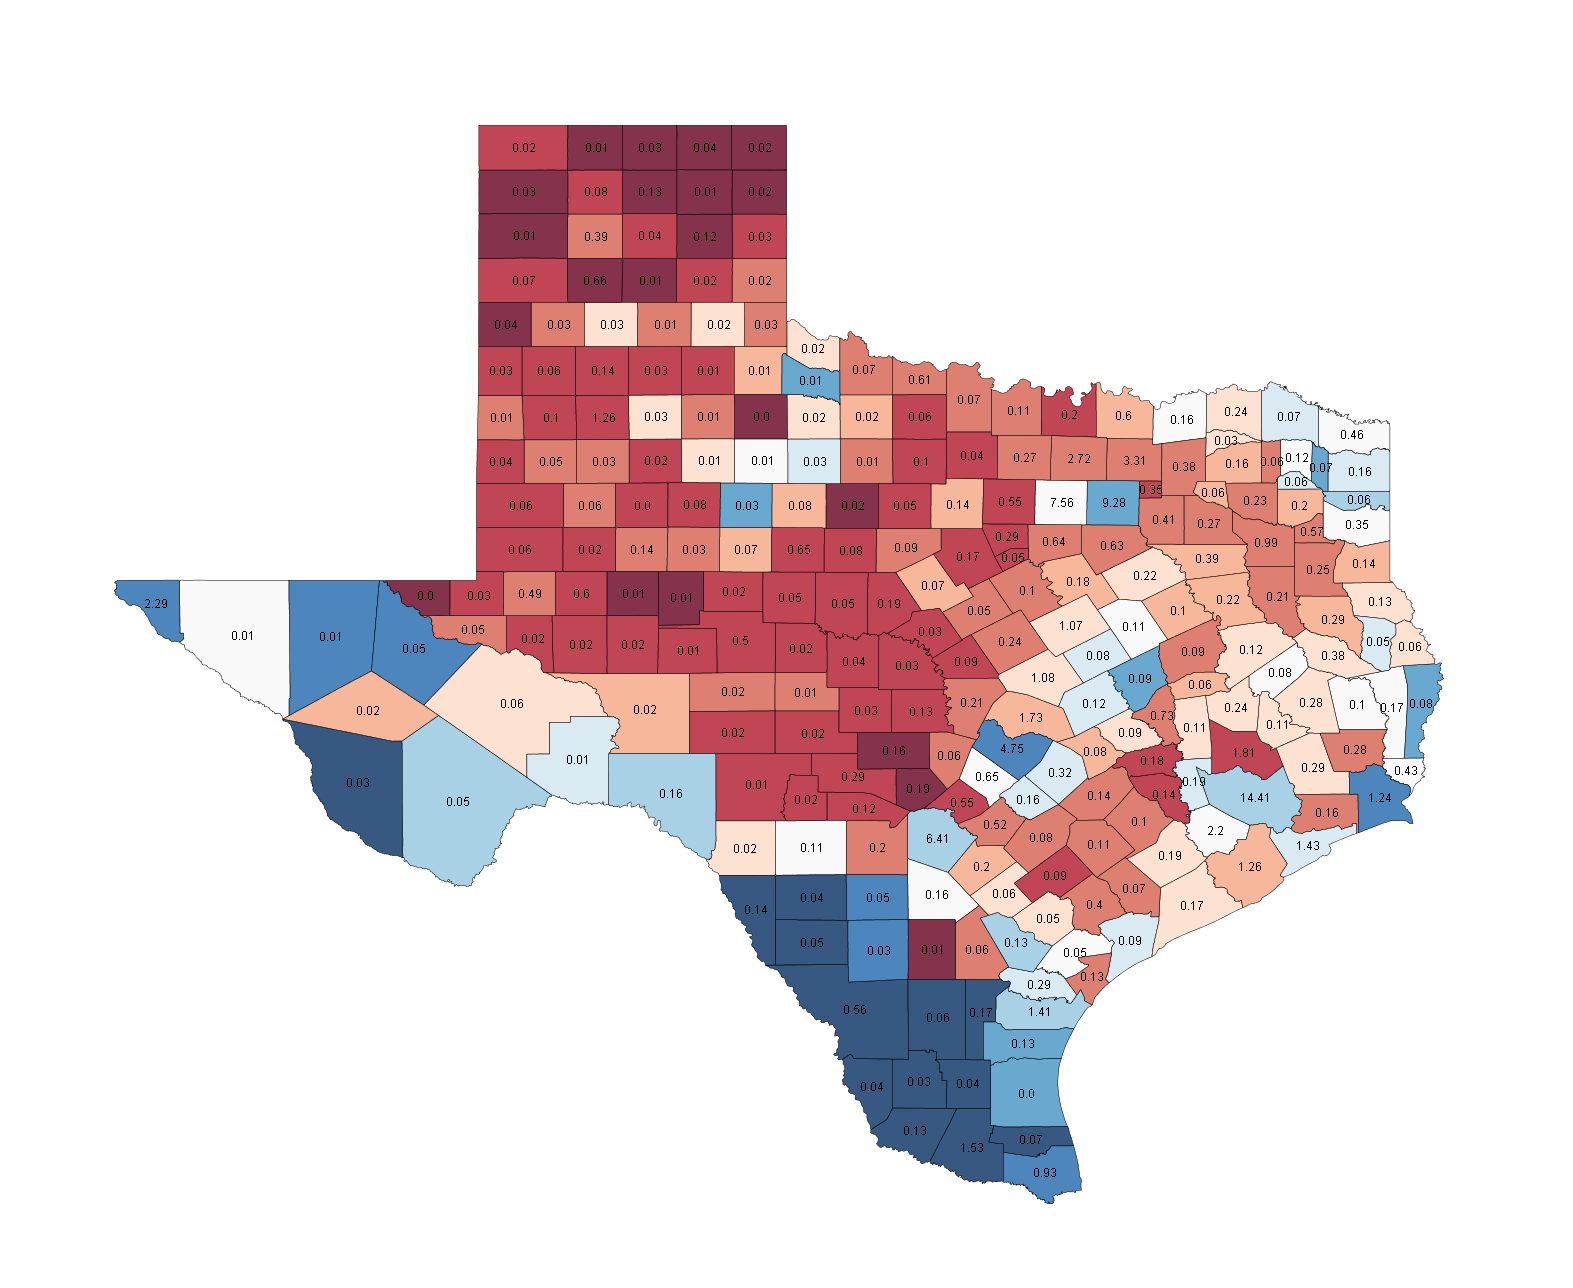
TEXAS
This page includes a map of county names
Races (538 Average/SSP Rating): President - Safe McCain (O 44.1, M 55.8) Senate - Safe Republican (D 42.9, R 54.3) House - TX-07, Skelly v. Culberson(i) (Likely R), TX-10 Doherty v. McCaul(i) (Likely R), TX-22 Lampson(i) v. Olson (Toss-up), TX-23 Rodriguez(i) v. Larson (Likely D)
Texas is one state that is turning blue fairly reasonably fast, but is probably still a couple of election cycles from delivering state wide Democratic wins. However, it's important to remember that twenty-point state-wide losses like George W. Bush won have not been the norm in Texas, with only Mondale and McGovern losing by margins that large since LBJ. So some tightening is expected, and we are seeing it, with Obama just on the cusp of a single-digit margin. John Conryn's race against O2B Senate candidate Rick Noriega looks like he is set for a similar margin of defeat, though there is a major caveat in this race for me, which is that there have been only two polls in the last ten days or so. One showed Cornyn rallying to a 15 point lead, while the other showed it at 9. Rasmussen and R2K have showed it as close as 6 or 7 during the month. While it'll be tough for Noriega, this is the kind of race that could end up closer than expected. However, given the general Republican lean of the state, it could just as easily move against him.
If the result in both races is about 55-45 for the Republican, as the numbers suggest, we pretty much know what that looks like, since that was the margin for Cornyn's first election in 2002. The are two basic regions of Democratic strength: the southwest of the state and the cities. The southwest blue counties are heavily Hispanic, and typically had at least 60-40 margins. While this is a very solid area, it is just too small in population, and is overrun by the number of small red counties in the north and centre of the state, many of which were 75-25 or 80-20 Bush counties.
There are several Democratic city areas, and a win for Noriega will certainly require carrying all of them. Just to the north of the strongest blue area is a light blue county labeled '6.41', Bexar County, home to San Antonio, typically around 5 points more Democratic than the state, but the large shifts towards Democrats seen in the Latino vote, a group that makes up 54% of the county population, may shift it even further in that direction, helping Noriega to carry it. Just to the northeast is darker blue Travis County, home to Austin. Further to the west is a pale blue county labeled '14.41', Houston, Harris County. The Houston area typically runs about 5 points towards the Democrat, so a close race for either candidate must certainly find them winning here. The final city is the blue county to the north, surrounded by pale red, Dallas County. Kerry came less than 10000 votes from carrying this county, which would have been his only one north of Austin, and Obama and Noriega will definitely win it.
Counties to watch: The swing areas of the state can basically be divided into two segments, areas surrounding cities and the eastern border counties of the state. The largest such county is Tarrant County, Ft. Worth, just west of Dallas, as it is typically only about a point behind the Democratic candidate. For Noriega to have a chance, this is not a must win, but it cannot realistically have more than a margin of a few points. Smaller suburban areas that are white or pale-blue around the other cities must be turned from counties Cornyn won by around 10 in 2002 to basically dead even or blue, a difficult task.
The east of the state is also a key area, powering Bill Clinton's '92 Perot aided run at Bush Sr. in the state, an example of which is Bowie at the northeast corner, a 55-45 Cornyn county. These areas are typically around 20% African-American, and if turnout for these voters is increased, the eastern edge could find some counties turning blue.
A report from the guys at Burnt Orange Report suggests early voting is significantly up in the largest counties in the state, but the county specific results are a mixed bag, as turnout is up in a couple of suburban swing counties, it is also high in the Republican counties north of Dallas, Collin and Denton, and it is the lowest in El Paso and Hidalgo, two heavily Hispanic and heavily Democratic areas. There clearly is still more work to be done with the Hispanic community in the state to get those two areas right near the top. The good news is that early voting is up more than 500,000 votes in the biggest 5 counties, all Democratic or swing. Ultimately, it doesn't look like there's enough here to give much hope to Noriega, but he's got a shot at keeping it close, and from there anything can happen.
The four close Texas house races are all against incumbents, with the likely Democratic hold coming from a fascinating district, TX-23. This was a protected majority-minority county under the Voting Rights act, but redistricting in the early part of the decade resulted in it falling short of a majority-minority voting-age population. Ciro Rodriguez then won it in a run-off after no candidate reached 50% in the initial election. The 23rd stretches over a huge amount of land from the edge of El Paso in the west to the edge of San Antonio in the east, and should be fairly safe. TX-07, contained within a more Republican area of generally more Democratic Houston, and TX-10, a district straddling the edge of Houston before moving west over some Republican territory to part of Austin are possible pickups, and would be well served by strong Obama/Noriega showings. Nick Lampson's TX-22, Tom Delay's old district, is in a blue area, but is quite conservative, having the southern Houston suburbs and not the stronger city areas. Lampson had a write-in get 43% against him, and recent polling has been troubling.
Where the people are: I've talked about the five largest counties, which are Harris (Houston), Dallas, Tarrant (Ft. Worth), Bexar (San Antonio) and Travis(Austin) all of which except Tarrant are somewhat Democratic, but probably not by enough.
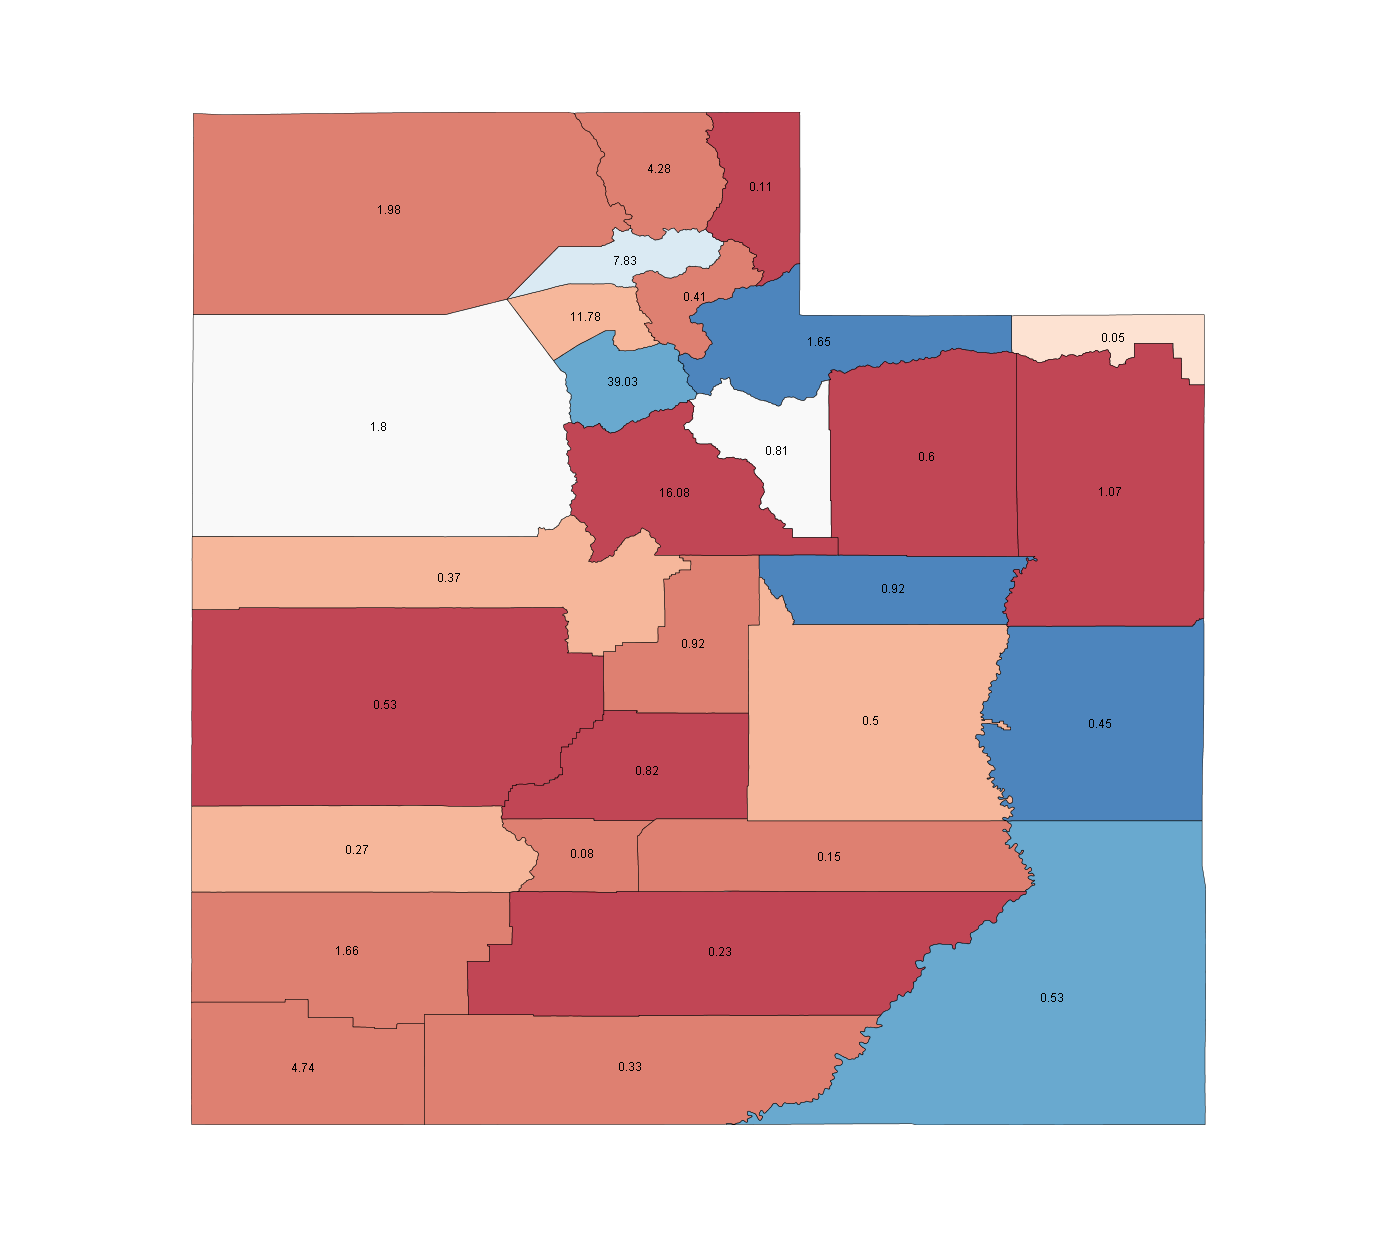
UTAH
This page includes a map of county names
Races (538 Average/SSP Rating): President - Safe McCain (O 35.9, M 61.4) Senate - None House - None Close
The good news is that Obama has been polling nearly 20 points higher in the state than the Democratic candidate for Governor. The bad news is that the Gubernatorial candidate is polling just above single digits.
There is some semi-serious good news in the state, depending on whether you believe the polling numbers or the 538 projections. If Obama can get to the vote Nate Silver has him at, nearly 36%, there are as many as three counties that could potentially shift blue, the first time any federal state-wide candidate had carried a county since '96. Also, 36% would be the highest Democratic number in the state in 40 years. Small successes maybe, but successes nonetheless, if accomplished.
Democrats are strong, relatively, in three key counties, from north to south, Summit, Carbon and Grand, composing about 3% of the state's vote. I can explain at least one of these. Summit is the most religiously diverse county in the state, with 40% claiming no religion and less than 40% Mormons. Summit contains upscale districts in Park City, and voted against a same-sex marriage ban in the state. If Obama wins a county, it'll be this one.
Counties to watch: Just south of Summit is Wasatach County, which runs about a point behind the Democrat, but is reasonably consistent at that. Watch here for the margin.
Where the people are: Salt Lake City and it's northern statistical area include almost 60% of the state's vote, with another 16% just south in the Provo area.
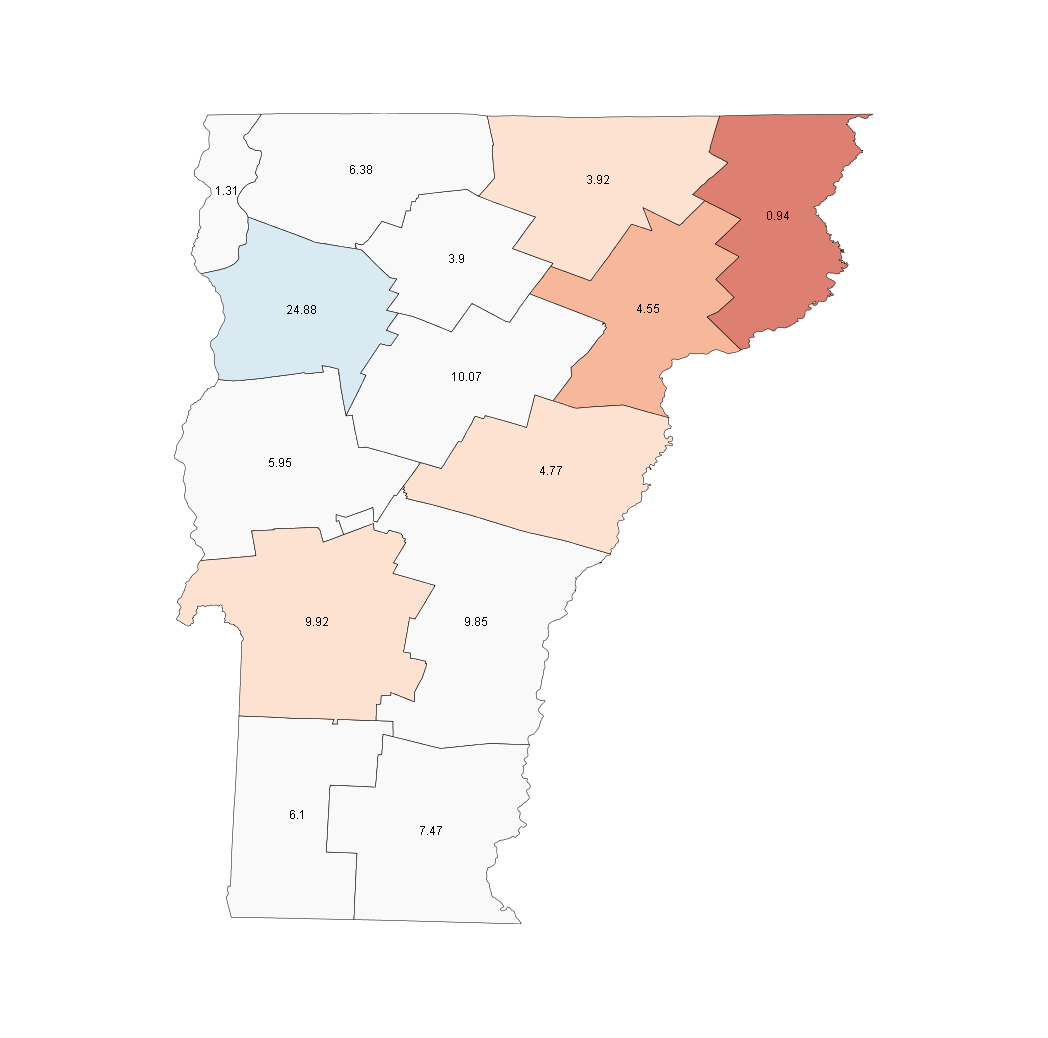
VERMONT
This page includes a map of county names
Races (538 Average/SSP Rating): President - Safe Obama (O 59.9, M 37.9) Senate - None House - None Close
There's not a lot to say about Vermont, as all three races look quite safe, and given that Senator Bernie Sanders describes himself as a "Democratic Socialist", that McCain line of attack might boost Obama's numbers. But even while this is a safe state, remember that between LBJ and Clinton, Vermont was a Republican state, and that Al Gore only carried it by 10 points. In fact, even in a 20 point win, John Kerry didn't sweep the state, losing Essex County in the northeast, and fairly decisively. The strength of Democrats comes in the west of the state, in light blue Chittenden County, home to Burlington, a 65-35 Kerry area.
The Governor's race is interesting to watch, but only because there is an interesting battle for second place between independent Anthony Pollina and Democrat Gaye Symington. This is a surprise mostly because Symington is the Speaker of the Vermont House, not a fringe Democratic candidate, as Democrats who finished third to Sanders in his house races often were. Still, the race for first is over, with an easy Republican win.
Counties to watch: If you have to watch somewhere in a state as uncompetitive as this, watch just to the north of Burlington, Franklin County. This was only a 50-44 Gore county and a 53-45 Kerry county. An Obama margin larger than Kerry's would suggest an even larger blowout in the state.
Where the people are: Burlington, in the west, has 25% of voters within the county. Another 10% live just east of that in the Montpelier area.
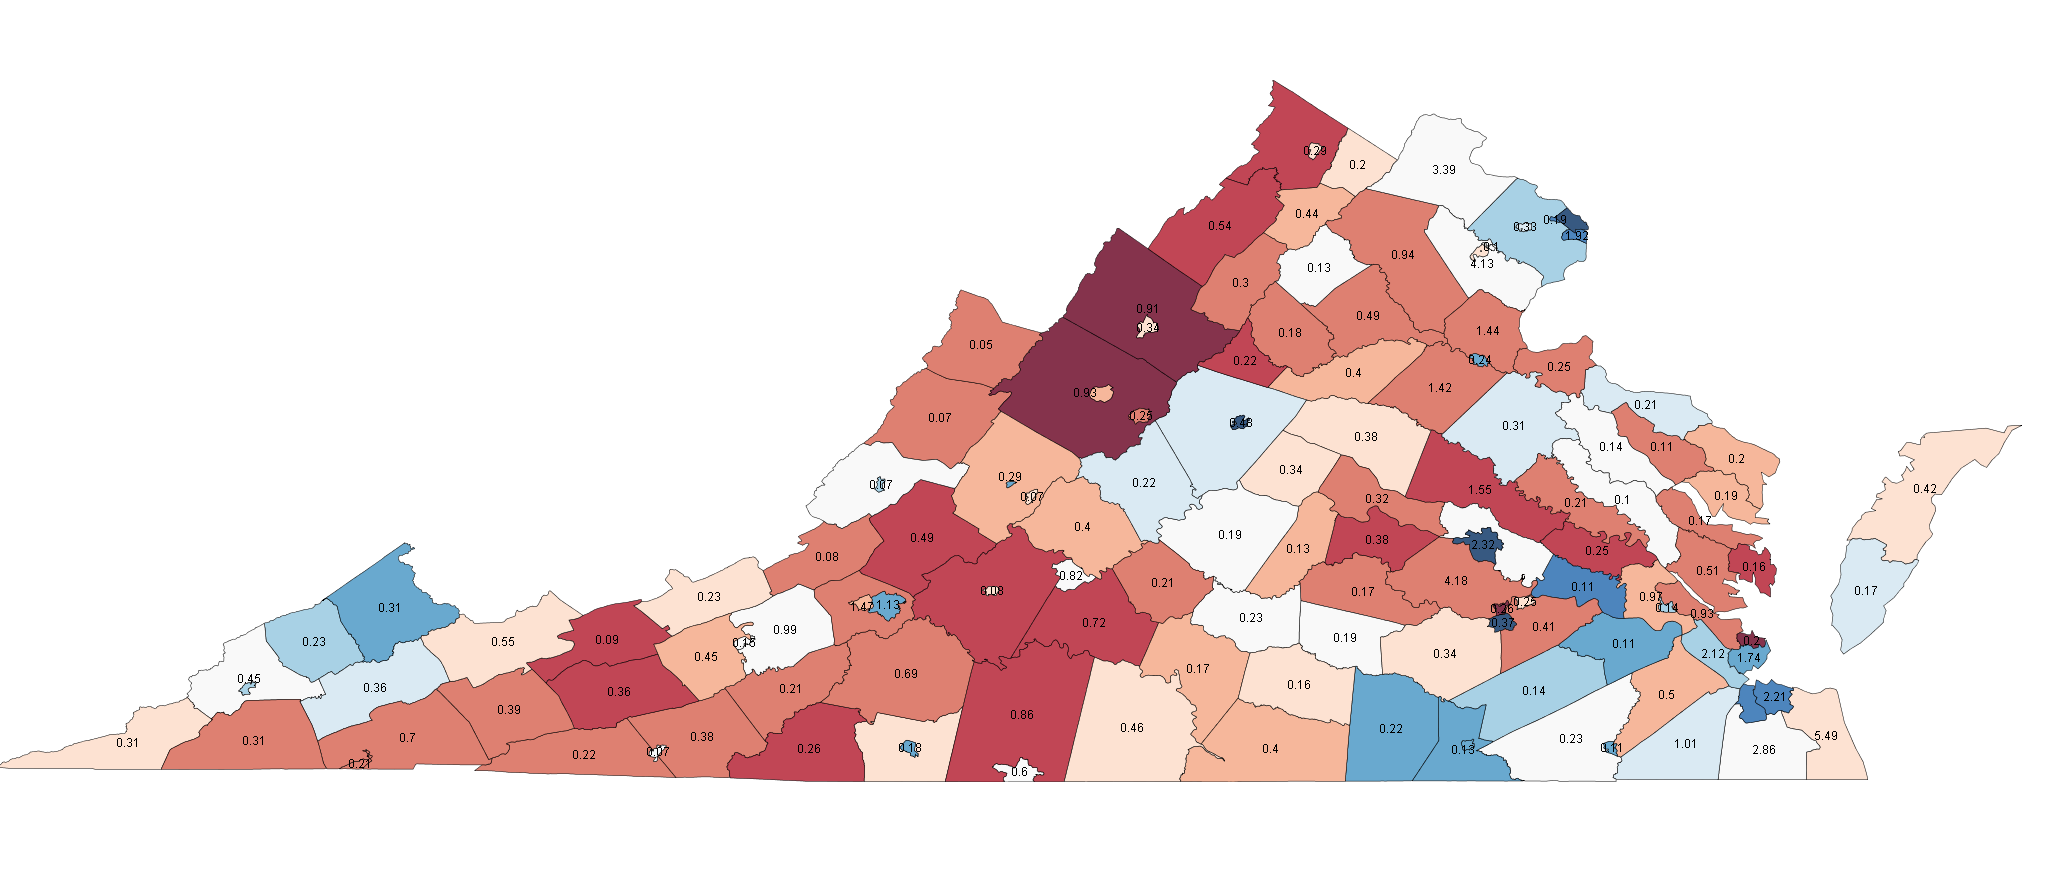
VIRGINIA
This page includes a map of county names
Races (538 Average/SSP Rating): President - Safe Obama (O 52.3, M 46.9) Senate - Safe Democratic (D 63.3, R 37.7) House - VA-02, Nye v. Drake(i) (Lean R), VA-05, Perriello v. Goode(i) (Lean R), VA-10 Feder v. Wolf(i) (Likely R), VA-11 Connolly v. Fimian (Toss-up)
Virginia, I'm sorry, but you're officially my least favourite state. In Virginia, cities are not generally part of larger counties, but independent units, the small, usually blue or at least lighter red dots inside the counties. These make my maps quite unwieldy, as it's difficult to see, even from close zoom in some cases, the strength of some areas. Only 42 cities in the country are independent from counties, and 39 are in Virginia, with the other three somewhat larger areas, St. Louis City, Carson City, Nevada, and Baltimore City, all of which we have covered.
However, this state may be one of the most important Presidential swing states, so I can hardly ignore it because I don't like the map. Virginia is talked about as a solid red state because of the fact that it's gone Republican since LBJ, but it hasn't been blood-red for a long time, being within single digits each of the last four presidential elections, and with Democrats winning every Governor's race in the last 8 years.
Northern Virginia is a strong Democratic area, and every suggestion is that it is only getting stronger. Take the pale blue county in the north, Fairfax County. In 2000, Al Gore lost here, but ran 3 points ahead of his state number. Kerry won, and was nearly 8 points ahead of his state number. Webb also won, but was more than 9 points ahead of his state number. This is an area where John McCain was only a few days ago, and while he won't carry it, the question is margin. A 60-40 split, as Webb had, is enough to win the state. Arlington, the deep blue area within Fairfax, is another key Democratic area.
Other places Democrats must turn out are Richmond, the deep blue in the eastern centre of the state and Norfolk and Portsmouth on the southern part of the coast. The two strongest Republican counties are just around Staunton and Harrisonburg (thanks to Seonachan for the fix)in the northwest, and were 70-30 Allen counties in 2006.
Counties to watch: The one useful thing about Virginia's county/city setup, from an analysis perspective, is that it's somewhat easier to get a sense for how the suburban areas around cities are breaking. Indeed, the majority of the key swing votes in the state lie in these suburban counties. The most important areas are again, in the north, around Fairfax, the two white counties to the west and south, Loudon and Prince William County. Prince William, containing the independent city of Manassas, has voted within a point of each of the last three federal races in Virginia, and was a two point win for Jim Webb, and while Loudon County has lagged somewhat behind, it is also a fast growing area that tipped more to Webb than Kerry or Bush. Obama wins in this area suggest a win in the state, and large Obama margins suggest a fairly safe carry of the state.
Other swing counties fall outside Democratic city areas. Examples include the Chesapeake City area, south of Norfolk, which is slightly Republican, but close, and Henrico County north of Richmond, which was basically dead even in 2006. The western areas will generally be quite red, but remember that the small flecks of blue will typically be as large in vote size, if not larger, than than the wider areas. Still, Obama should pick up the handful of blue counties in the far west, and just focus on keeping margins down in the rest of the area. This race seems to me like it will be decided by growth and Democratic movement in the cities and suburbs of the North, and that's where to watch.
These Northern swing counties are also involved in two of the competitive House races, as the open seat in VA-11 covers a large part of expected Democratic ground in Fairfax and Prince William counties. VA-10 stretches west from Fairfax to the northern corner of the state, and while this includes some fairly red areas, most of the population of the district comes from Loudon County. If Obama/Warner voters take the lion's share of these counties, it will be good news for the Democratic House candidates as well. VA-05 stretches over the south-central area of the state, with some heavy Republican areas, but also stretching east to the Democratic counties on the southern border and north to the light blue counties around Charlottesville City. The swing counties that connect the two darker blue areas will be the key to tipping the district. The final competitive district is VA-02, which covers the two counties that look like an island here, but actually border Maryland on the Delmarva Peninsula. Northhampton in the south is blue-leaning, while Accomack is slightly Republican. Accomack is much more of the population of the district, though, so this will need to be very close for the Democrat to win.
Where the people are: Most of the city areas are mentioned above, but more than a quarter of the vote lies in the northern part of the state, with another 10% around Richmond, and another 12-13% on the southeastern coast.
WASHINGTON
This page includes a map of county names
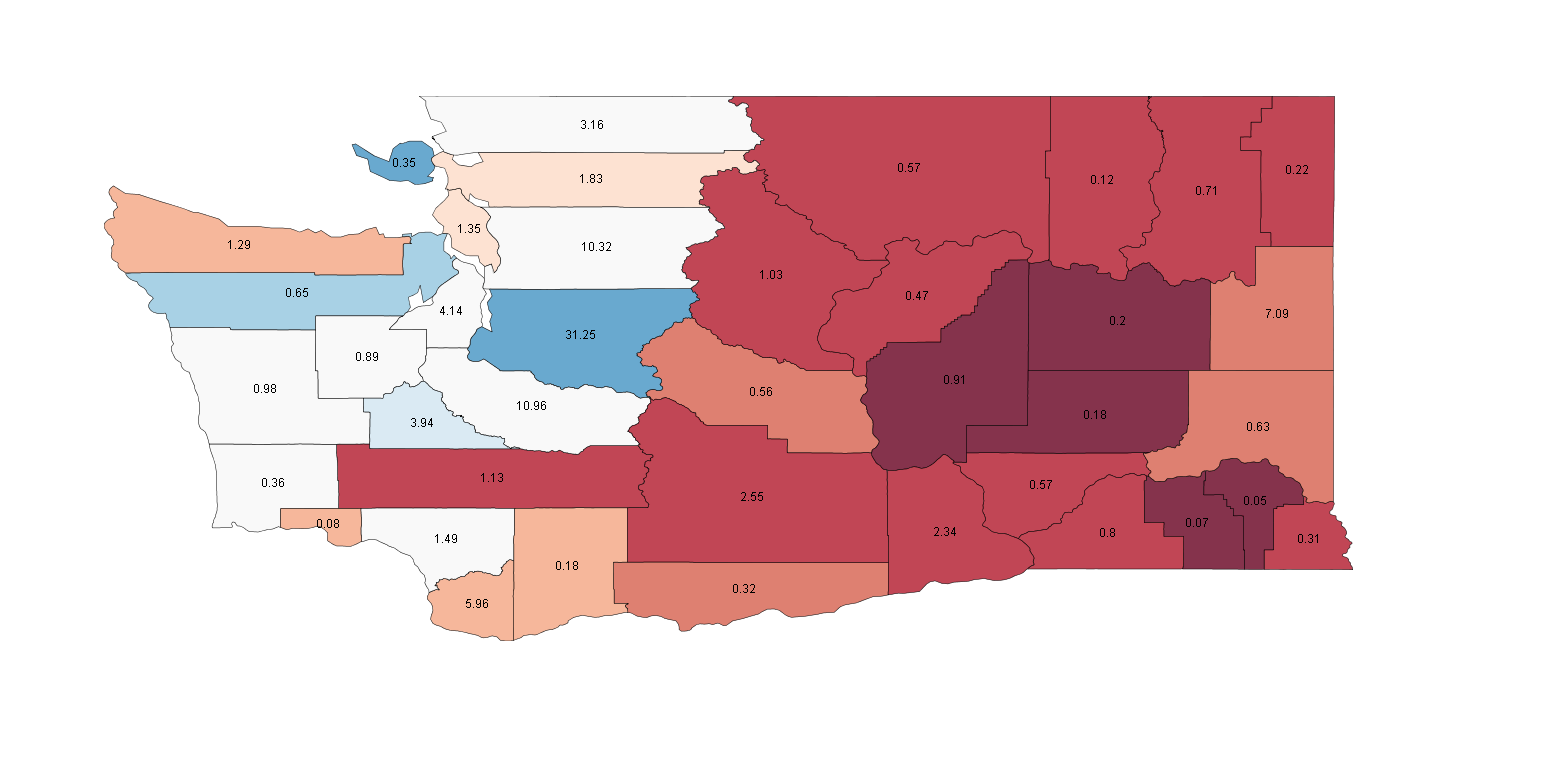
Races (538 Average/SSP Rating): President - Safe Obama (O 56.4, M 42.6) Senate - None Governor - Gregoire v. Rossi (Toss-up) House - WA-08, Burner v. Reichert(i) (Toss-up)
Washington is a state that went for Gore and Kerry by single digits, but current polling suggests no such close race for Obama, as John McCain has failed to crack 40% in three of the last six statewide polls. The real race, though is for the governor's mansion, featuring Christine Gregoire against Dino Rossi, in a race that was decided by 130 votes out of more than 2.5 million last time around. A recap of the epic recount battle is here, but the good news for Gregoire is that recent polls have her slightly ahead, while in 2004 SUSA's last poll showed her well back. So, there is a likely map for this race, and in 2004 of the 8 swing counties, each candidate won 4, and all were within 4 points.
The main area of Democratic strength in the state is King County, a 65-35 Kerry county, home to Seattle and many of the state's voters. Increases in turnout here can boost Democratic vote as much as winning the swing counties, so the margins here are critical. Like Oregon and California, the eastern part of the state is much more Republican, with some 70-30 Bush counties, but all of the deep-red and brick-red counties combined have about as many votes as either swing county flanking Seattle.
Counties to watch: The fact that my index picked out the 8 closest counties in 2004 Governor's race, when it doesn't have data for that race, and only one data set from the 2004 election in the state, is quite heartening, and also gives you a good idea of where to watch. Part of the problem for Gregoire last time was that while she won 4 swing counties, she lost the three largest, especially fast-growing Snohomish, north of Seattle, and Pierce south of Seattle. Improving the couple of points needed to make these counties even slightly blue would be enough to take the race in such a close battle. Should that not happen, the battle will turn to the other swing areas. Just west of Seattle, Kitsom and Mason were Rossi counties, while Gregoire won in the west, the south, Cowlitz County, and the north, Whatcom County. However, only one of these four wins was by more than 2%, and, failing larger gains in the Seattle area, these margins will have to expand. If you see Gregoire losing any of those four key counties that she won last time, there could be trouble.
The main house race is one featured on the head of the frontpage as I write this (but probably not by the time I publish), Darcy Burner and Dave Reichert's rematch in WA-08. Reichert didn't reach 52% in either previous election of his, but Burner just fell short last time. WA-08 covers the western part of Kings County and Pierce County to the south, but this does not include more Democratic areas of the heart of Seattle, and the district has never elected a Democrat since it's creation. Still, the area is turning blue, and Pierce County will likely deliver around 55% for Obama, which can only help both Gregoire and Burner.
Where the people are: Most are in the west, as is typical on the Pacific coast, with 30% in King County and a further 20% in the north and south, featuring Everett and Tacoma, respectively. Another 7% are in Spokane on the eastern border, and 6% in Vancouver in the southwest, both slightly Republican areas.
WEST VIRGINIA
This page includes a map of county names
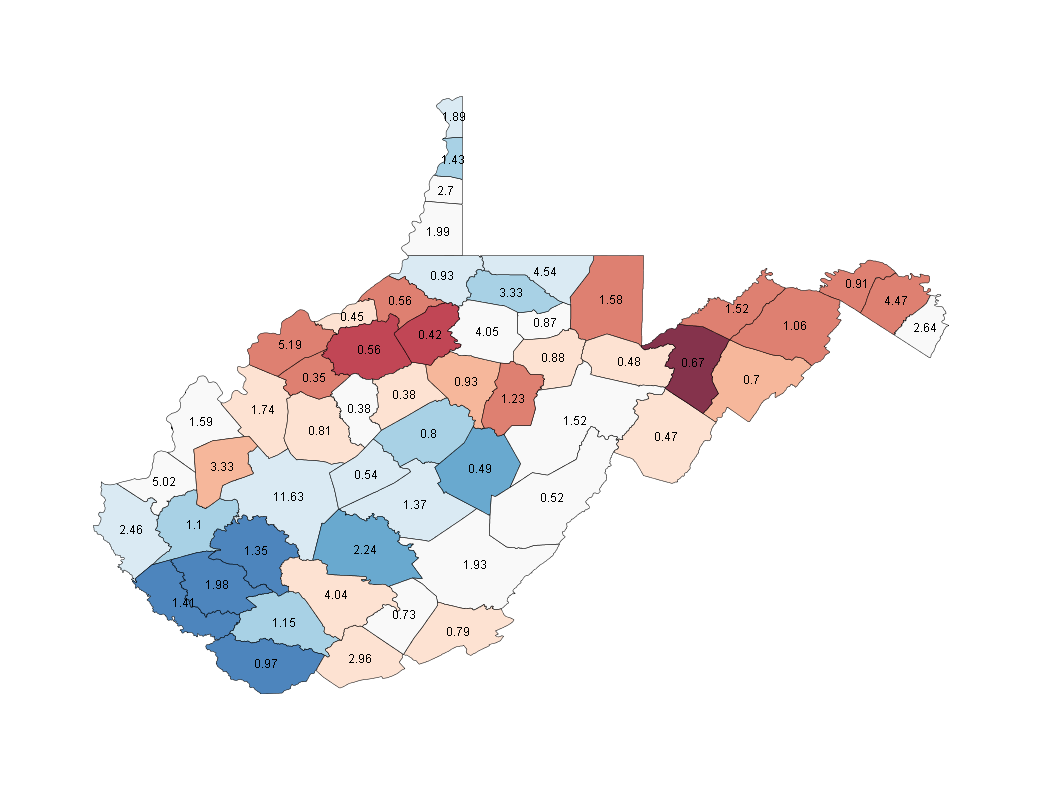
Races (538 Average/SSP Rating): President - Safe McCain (O 44.2, M 54.5) Senate - Safe Democratic (D 61.6, R 37.0) Governor - Safe Democratic House - WV-02, Barth v. Capito(i) (Lean R)
There's been a lot of talk about this state, especially during the primaries, but also as it briefly seemed to flirt with a close presidential race, though more reliable pollsters seemed to reduce that hype. The fact is that, regardless of any potential racism, this is a state that may have a larger Republican margin for McCain than Bush, maybe only one or two others of which we've seen. Even in that climate, though, Obama will still carry a decent number of counties in the state, I suspect. As in other states in and around Appalachia, the areas I will be watching are the heavily Democratic, heavily white counties in the south. Just as in Kentucky, all of these counties have been Democratic for more than 30 years, and at least one, Logan, sandwiched in between the two other dark blue counties, has been Democratic since at least '60. The pale blue counties north of these, and in the north of the state, are less solidly Democratic, and given the expected state margins will likely go to McCain. The problems for Democrats are in the east and west, as Parkersburg in the east and Martinsburg in the west are fairly large, Republican counties, that went for Bush 65-35 against Kerry. They must be closer for Obama to have a chance.
Counties to watch: In my mind, if Obama is to be close, the northern panhandle area and Huntington, along the southwest border, are areas he must be competitive in. Gore got margins of about 5-6 points in all these areas, but couldn't close the state, so Obama must be as close to have a chance, though it unfortunately looks unlikely.
WV-02 is the House race, Anne Barth trying to unseat Shelly Capito, the only Republican member in Congress for West Virginia. WV-02 runs all the way from the west of the state to the far east, over a solid mix of Democratic, Republican and toss-up counties. The two key counties will be Kanawha, pale-blue labeled '11.63' north of the strong Democratic areas, home to Charleston, and the tossup county in the far east of the state, Jefferson, which is interesting because it borders the key swing area of Loudon County in neighbouring Virginia, where Obama campaign and Democratic presence in media and excitement will likely be somewhat greater.
Where the people are: In the light-blue, dark-blue and tossup southwest, there is nearly 25% of the state's voters, with nearly half of that in the Charleston area. Another 7% are in the north near Morgantown, with Republican strongholds in the east and west each holding around 6-7% as well.
WISCONSIN
This page includes a map of county names

Races (538 Average/SSP Rating): President - Safe Obama (O 54.3, M 44.0) Senate - None House - WI-08, Kagen(i) v. Gard (Lean D)
For every West Virginia, where Obama may regress from Kerry's vote, there are two or three Wisconsins, where he has turned a 5700 vote win in 2000 and an 11000 vote win in 2004 into a very comfortable margin.
As we saw in Minnesota, the areas bordering Lake Superior are fairly strongly Democratic, but small, while the other area of Democratic strength lies in the southeast, namely Milwaukee, the blue county on the border surrounded by mostly red, and Dane County, home to Madison and just to the west. In particular, with Chicago just to the south of Milwaukee (the southeastern light blue county is in the Chicago Metro Area), it'll be interesting to see if the area will be slightly stronger for Obama than other national Democrats. The darkest blue in the state is Menominee County, my favourite county during the primaries, which is 88% aboriginal, consisting of the Mamaceqtaw, or Menominee Nation.
Counties to watch: The wide swath of pale counties across the west and centre of the state suggests to me that Obama could reduce McCain to a handful of counties in the direct area around Milwaukee. Given the margins, I also suspect McCain might not win a county west of Dane. If McCain is keeping it even in these counties in the west, things will be closer than expected, and eyes will then fall to the eastern border as well, which contains a fair amount of the swing vote, both north and south of Milwaukee.
WI-08 has a decent Republican lean, as it is basically an inverted "L" at the northeast corner of the state. It Contains Menominee county, but the race will be decided in the pale red counties to the south, labeled '3.0' and '4.11', Outagamie and Brown Counties, respectively. This area includes Green Bay, and holds most of the district's population. A wider Democratic victory than there's been in some time should help in holding a Democratic seat.
Where the people are: Around 50% of the votes are in the southeast, in the areas between and around Milwaukee and Madison. Another 7-8% are in the Green Bay area, with the rest more diffusely spread out.
WYOMING
This page includes a map of county names
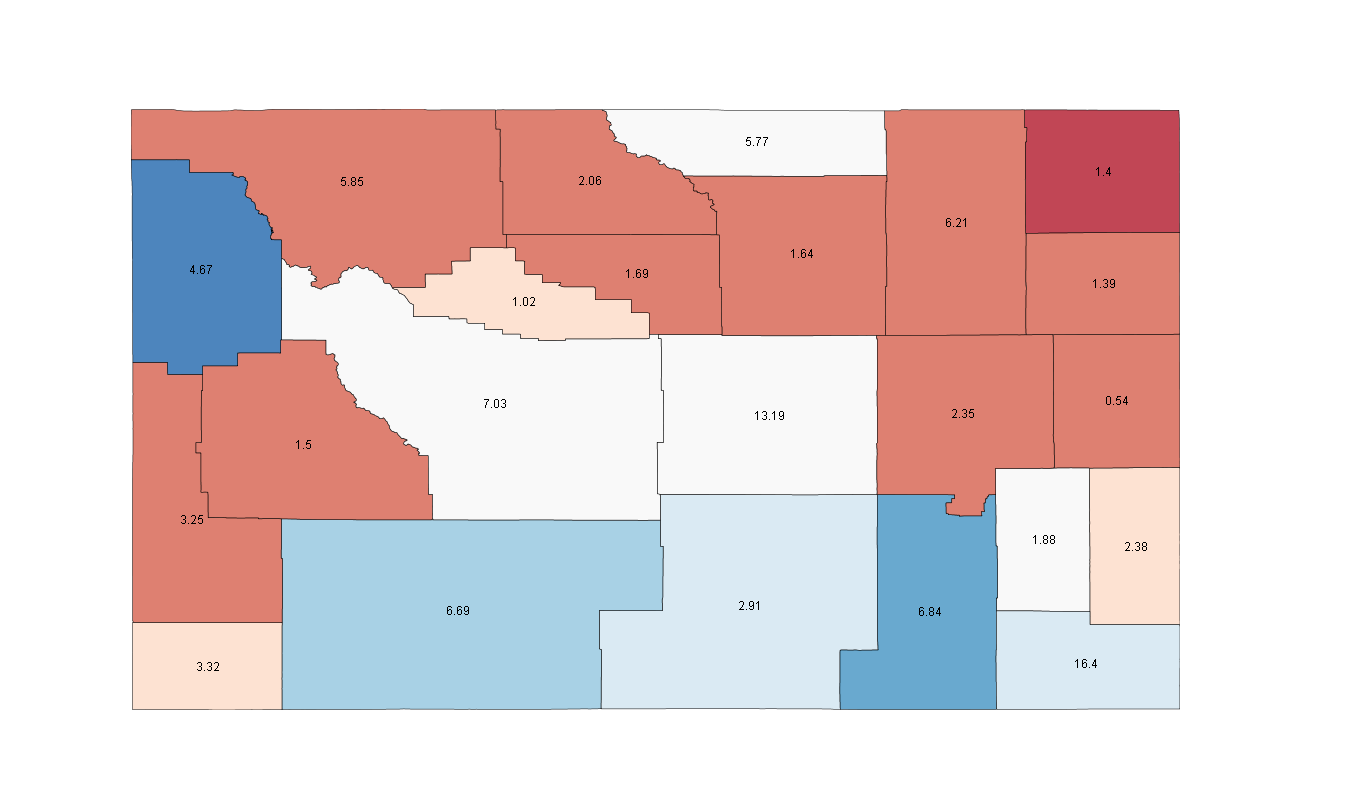
Races (538 Average/SSP Rating): President - Safe McCain (O 36.8, M 62.0) Senate A - Safe Republican (D 29.6, R 68.0) Senate B - Safe Republican (D 33.4, R 64.1) House - WY-AL Trauner v. Lummis (Lean R)
This is another state that will quietly, at least on the Presidential and Senate level, show its desire for change, as a good Obama night could see him out-poll Kerry and Gore by nearly 10 points.
But the big race here is the at-large house race, for O2B candidate Gary Trauner, who came only a thousand votes shy last time, out of more than 200K total votes. Given that this has typically been a blowout state, it's hard to really get a sense of where the race will be, but fortunately, we have Trauner's 2006 race to analyze.
Counties to watch: Trauner built up good margins in the blue areas, especially Teton in the west, Albany, the darker and Laramie, the lighter in the southeastern corner, and Sweetwater in the southwest. His weaknesses were also as expected, along the northern and western borders. In the white county right at the dead centre of the state, Natrona, Trauner overperformed what this model expects somewhat, and claimed a solid win there, so if you see that on the big night, don't get too excited yet. The other three swing counties, along with the pale blue in the south, Carbon County, were very close. The swing county that snakes its way to touch two areas of Democratic support in the west, Fremont, was a 69 vote difference for Trauner. With the race looking similarly tight in the polls this year, if any of the swing counties, excepting Natrona, look like they are breaking for Trauner early, he will have a serious shot. His presidential anchor is less than previous candidates have had, but increased presidential turnout may also hurt him in a typically red state, as less active voters who are more likely to be Republicans may show up more.
Where the people are: The largest cities in the state are Cheyenne, in Laramie and Casper, in Natrona, both Trauner counties with around 13-15% of the vote each. So, even in Wyoming, Democrats thrive where the people are.
Wow, that's it. It's been an incredible trip from one end of the country to the other, and I still want to do a short profile on the District of Columbia.
Given that I've scanned the nation from end to end, I think I'll give my predictions based on the same questions the 'experts' answered here, if only to prove how unpredictable elections are.
Presidential Race: Obama 53, McCain 46; Obama 356, McCain 182. (O wins FL, NC, CO, OH, NV and one of MT or ND, probably ND) Senate: Election Night: 57 Dem, 40 Rep, 2 Ind; After Run-off: 57 Dem, 41 Rep, 2 Ind House: D 261 (+28), R 174 MN Senate: Franken 43, Coleman 42, Barkley 15 MS Senate B: Wicker 52, Musgrove 47 WA Governor + Margin: Gregoire +5 NC Pres + Margin: Obama +4 Wild-card: Maybe not a wild-card, but I think the AZ margin will be closer than PA at the presidential level.
As always, I hope people add their own thoughts, ideas and criticisms, hopefully constructive, in the comments. If you want to participate in the same predictions I did, please do, I'd like some competition. Also, I'd like some feedback on what you think can be improved in the series if I re-post them as a larger compendium on the big day, or maybe tomorrow, and if I do what the compendium should include and when I should put it out. For those who have just discovered this series, please go back and read the other parts if you enjoyed this, and if you've read them all, thanks for following, I hope you've learned as much as I have.