Hi, everyone. One of my favourite parts of any election night's coverage on CNN is 'the big board', specifically when John King goes through a race's results and boldly proclaims "This is where the people are". Also, there is nothing quite like the drama of a statewide race in Missouri where the Republican is 5 or 6 points up, but you can see St. Louis is still out...
PART 1 HEREPART 2 HEREPART 3 HEREPART 5 HERE
**If you've read the other entries in this series, the introduction below is identical, so you can just skip to the maps**
PART 1 HEREPART 2 HEREPART 3 HEREPART 5 HERE
Also, please drop by visit for the guys at Stochastic Democracy It looks like I'll be doing some live-blogging over there during Election Night, and they're looking like having a really cool system for calling elections that any numbers buff should check out.
However, other than the basics of 'Democrats live more in cities', it's tough to really get a sense of how a race is going to unfold based on what's shown on TV, especially when an important race in the Senate, of which there are several, get fairly little attention in the wake of a Presidential call.
So, I decided to try and help out myself, and by posting this, other Daily Kos readers, by calculating, for every county in the country, a partisan voting index. Think of this as the same as a regular PVI, only at a county level, relative to the overall state result, rather than at the CD-level relative to the overall national result. To do this, I took the results for the Democratic candidate in each county for the last two presidential races and the last two senate races and calculated by how much they differed from the overall state result for the Democrat in the same race.
For example:
2006 VA Senate - Statewide, Webb 49.6% - Rappahannock County, Webb 51.6%, for a rating of +2.0%
By averaging the results from these four races, weighting for the more recent, and weighting the Presidential race over the Senate races a little, I calculated each county's Blarghman County Voting Index (BCVI).
What does this mean, you ask? Well, basically, what it means is that as results come in, you can look at the BCVI values, or more appropriately, the maps I have created that show them, and figure out if the results yet to come favour the Democrat or the Republican. Also, they can give you an early idea of how a candidate is doing.
As in the example above, consider, Rappahannock County, VA. While it was 2 points more for Webb than the state overall, when the other races are factored in, it is about even with the state average. This is reflected in the fact that John Kerry earned 45.4% in the county, and 45.5% in the state.
So, if Rappahannock reports fairly early on Election Night (purely speculation on my part), and Obama is above 50%, it's a very good sign that he will have a good chance at winning the state. To me, this is fascinating stuff, and can really give a lot of input to avid political viewers like myself and many others here.
So, with just a little further ado, I am going to present some maps, along with some brief discussion, of the first 10 states alphabetically, with the maps shaded by BCVI value.
**IMPORTANT NOTES ABOUT MAPS AND ANALYSIS**
- Remember that these are a voting index, not a vote total. The maps depict how far from a STATE AVERAGE a Democrat is expected to be in a given county.
- These are based on data from past elections, and do not consider changes in turnout pattern in this election, nor demographic shifts since the last election. I don't see any way to realistically model these, so I must unfortunately ignore them.
- The number on each county represents it's percentage of overall state 2004 turnout, to give you a rough idea of, as John King puts it, "Where the people are".
- I don't live in any of these counties, and I never have, I'm a Canadian citizen, who is fascinated with the mathematics, statistics, polling, drama and scope of US elections. So if you have something you know about your area that I've mischaracterized, please let me and others know in the comments, and I'll try and fix it.
- Note, unsurprisingly, the deeper red indicate more Republican areas, with the deepest red indicating a Index value lower than -20. The same is true for deepest blue and Democratic counties above +20. White indicates counties that are plus or minus 2.5 from the state average.
- To see a map bigger, including the numbers at much higher quality, at least in Firefox, right click and select 'View Image'. For IE, I think you have to choose 'Save Image', then view it once you've downloaded it.
- Really, this is #1 again, but you can basically consider these maps as a 50-50 scenario, ie. "what if the Democrat and the Republican tied in state X?". For some blood-red and ocean-blue (what else is deep blue, anyone got anything?) states, these will look strange, if only because we aren't used to seeing maps where a Democrat is anywhere near 50% in, say, Idaho.
So, once more unto the breach we go.
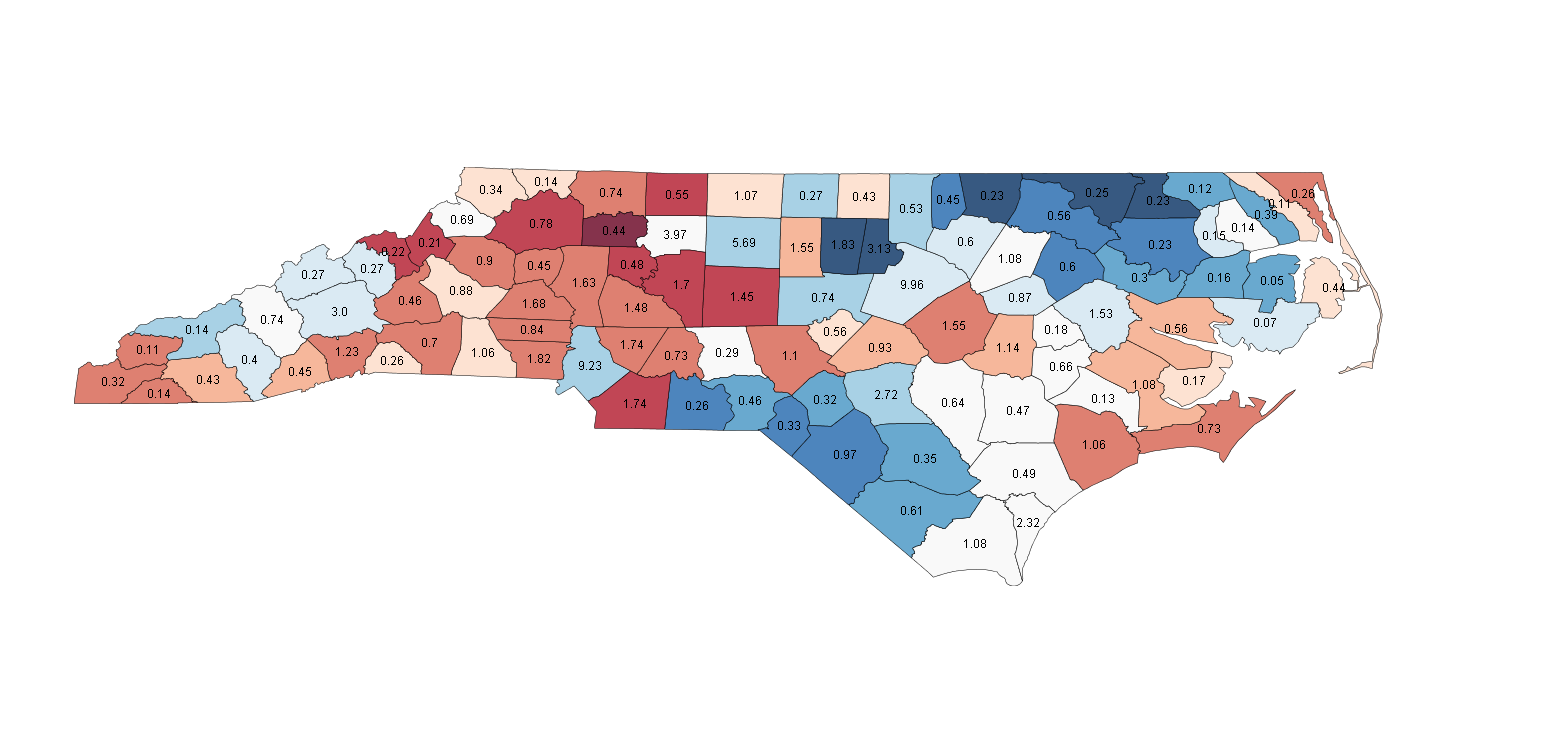
NORTH CAROLINA
This page includes a map of county names
Races (538 Average/SSP Rating): President - Lean Obama (O 50.2, M 49.0) Senate - Lean Democratic (D 47.5, R 46.8) Governor - Perdue v. McCrory (Toss-up) House - NC-05, Carter v. Foxx(i) (Likely R), NC-08 Kissell v. Hayes(i) (Toss-up), NC-10 Johnson v. McHenry(i) (Likely R)
You may very well see a similar map three times on election night, as there are three tight state-wide races, all of which could be decided by 1 or 2 points. North Carolina is typically thought of as a red state, because of back to back 13-point Bush margins, but it is worth noting that at the state level, there is strong Democratic organization and a Democratic electorate, as the Republicans have had just 3 terms in the Governor's mansion since 1901.
So, the key for Obama, Hagan and Perdue is to keep the strong Presidential counties blue and make inroads into the swing areas that have state-wide Democratic history. There are typically three areas that are won by Democrats in the state, centered around the blue areas of the map.
The first, in the west along the northern border of the state, is really two contiguous sub-areas, with very different characteristics. In the eastern part are smaller, heavily African-American counties that are fairly sparsely populated, while in the west, the blue areas are larger cities, also typically with high African-American populations. The darkest city area is mostly Durham, with Raleigh the lighter blue to the east, and Greensboro just to the west.
The second Democratic area is in the south, and again consists of smaller, fairly heavily Black rural areas, and the city of Charlotte just to the west. These rural counties are not as heavily Democratic as their northern counterparts, however, tending to have a higher white population.
The final area is in the west, and it is also the weakest, as no Democrat has won a county this far west in a Presidential race since Clinton in '96, though Kerry came close in the main population centre, pale blue labeled '3.0', Buncome County, or Asheville. If one of the three candidates is not winning most of these pale blue counties by at least a few points, their statewide chances may be poor.
The Republicans, in contrast have only one real stronghold area, in the western part of the state just where the northern border begins to slope southwards. These counties are not near big city areas, but are relatively large, certainly larger than many of the rural African-American counties that go Democratic are. These areas are typically not even won by Gubernatorial candidates in double-digit wins, and the goal for these three candidates in the region will be to hold the margins to 60-40 against, rather than 70-30. Republicans are also strong in the military-heavy eastern coast, but this is not as strong as the western area, and is not overly large in population.
Counties to watch: The real key in the state, though, are the swing counties that run between the two heavily black Democratic areas in the north and south. Typically, to be blue a rural county in the west of the state has to have around or above 40% African-Americans. The white counties that run between the two main areas of African-American population are typically 5-10 points short of this, enough to keep Kerry and Gore above 40, but not much more. This includes New Hanover County, the furthest southeast, home to Wilmington, and continues north to the areas south and east of Raleigh. These areas typically run a little stronger relatively for Senate candidates than Presidential candidates, but Obama may need them to have a chance.
If African-American turnout is high, as it has been in early voting, these counties are where we may see it's effects in shifting counties from red to blue, along with the help of Obama's gains among white voters. Unlike black turnout in cities, which is typically harder to see, as it just turns blue bluer, these counties may flip if blacks can outperform their percentage of the population and, as Tom Jensen of NC based Public Policy Polling points out, it's also about a larger black margin, at least for Obama. Another factor Jensen points out is the shift in Wake County, Raleigh. This area has been trending blue in recent years, going near 50-50 for Kerry, and if this continues, big margins could help all three candidates. Winning Democrats in North Carolina tend to form a wall of Democratic counties between the coastal and inland Republicans, and if you see such a wall forming on Tuesday night, it should be good news for whichever Democratic candidate manages it.
The three interesting House races are all in the strong Republican centre of the state, a common theme in this Democratic year. Larry Kissel's NC-08 challenge is the best looking on the map, as NC-08 includes part of the Charlotte area in the south, then stretches to include some of the blue counties that should help Kissel build a margin. NC-05 and NC-10 are harder rated and tougher-looking, with almost no blue area in either. NC-10 starts just east of the blue counties around Asheville, and stretches across 70-30 Bush country until it stops just west of Charlotte. NC-05 is in the northeast corner, stretching west and stopping short of Greensboro, though it does include parts of the swing county of Forsyth, home to Winston-Salem. The winning strategies are basically the opposite, as Carter in NC-05 has to win the counties on the extreme east and west of the district while holding the centre, and Johnson in NC-10 has to win the pale red counties in the centre while holding off the red to the outside.
Where the people are: More than a quarter of voters live in the seven adjacent counties that include Winston-Salem, Durham and Raleigh. Another nearly 20% live in the southern border area around Charlotte.
NORTH DAKOTA
This page includes a map of county names

Races (538 Average/SSP Rating): President - Likely McCain (O 47.4, M 50.7) Senate - None House - None Close
North Dakota is a strange state, giving huge 30 points wins to George Bush, but huge 40 and 50 point wins to its two Democratic senators, so the map is at times somewhat inaccurate, just because the index can't really figure out what's going on in some counties. However, the two close races I did find a map for, Clinton's 6 point loss in '96, and Earl Pomeroy's 2002 House win, pretty much validated at least the general trends in this map, which again could mirror the one we see on Election Night. The three strongest areas are heavily aboriginal, with Rolette in the north, Benson the lighter blue just below that and Sioux County in the south all being very reliably Democratic, and also areas where we will see if Obama's outreach to voters on reserves is as effective as some think it may be. Beyond these areas, Democrats are stronger in the more populated east of the state, though in this case stronger means 60-40 Bush counties.
Republican support is also somewhat diffuse, with no deeply red areas. The real key for them is the light red area labeled '12.41' just northeast of Sioux County. This is Burleigh County, containing the capital, Bismarck, and while it is not as Republican as some areas, it is a large population base that voted 70-30 Bush.
Counties to watch: To know if the race will be close, watch the east and the north, but especially the east, which has more people. In addition to the pale blue counties in the Fargo area, particularly Cass County, labeled 21.32 on the eastern border, Obama should be winning up and down the eastern border to have a chance at the state. In particular, he must likely win Cass County itself by at least a couple of points. If the county is blue early in the evening, things will be going quite well. The northern swing counties include Ward county, labeled '8.19' and containing the fourth-largest city, Minot. While the other large cities in North Dakota have more partisan lean, Minot tends to be a fairly even area, and with a decent chunk of the vote is another place Obama must at least stay close in if not win.
Where the people are: Four main cities account for more than half the state's votes, in pale blue Fargo, light blue Grand Forks just north of that, the swing city of Minot or the Republican capital area of Bismarck.
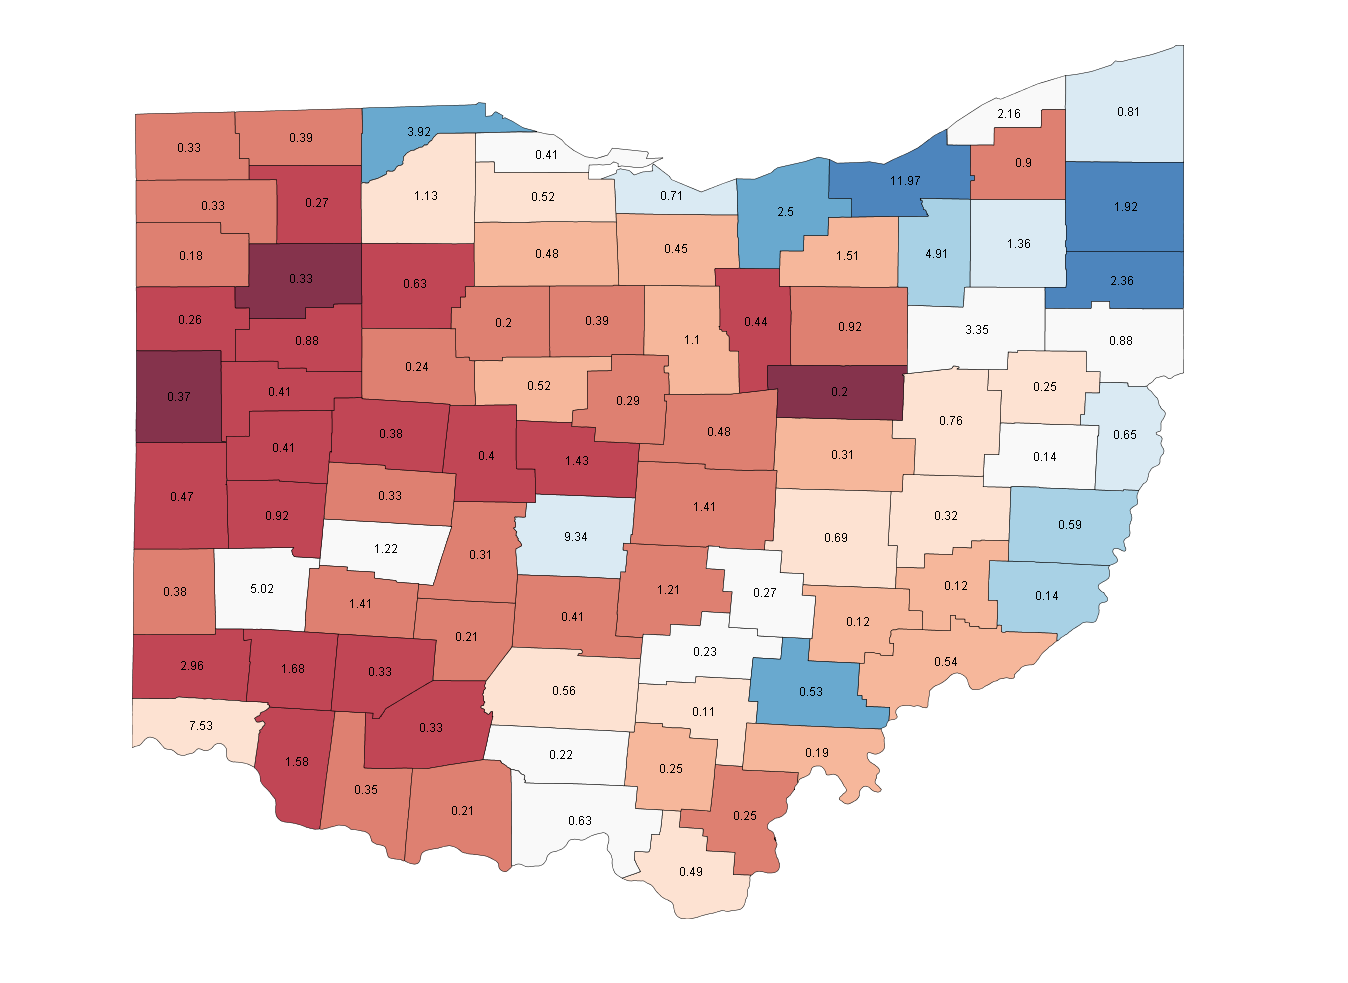
OHIO
This page includes a map of county names
Races (538 Average/SSP Rating): President - Likely Obama (O 51.0, M 47.5) Senate - None House - OH-01, Driehaus v. Chabot(i) (Toss-up), OH-02, Wulsin v. Schmidt(i) (Lean R), OH-07 Neuhardt v. Austria (Likely R), OH-15 Kilroy v. Stivers (Lean D), OH-16 Boccieri v. Schuring v. (Lean D)
I try to avoid the overall electoral race discussion in these state-based diaries, but I will mention that Ohio looks like huge trouble for John McCain. 11 of the last 14 public polls of the state have Obama up 4 or more, which generally tends to be outside the margin of error for most polls. So, hopefully, we will not be treated to a 50-50 map like above on Election night. If we are, though, there's been some reasonably strong precedent over the last 8 years. Typically, the state runs more Republican the further west you go, heading away from more blue Pennsylvania and towards more red (usually) Indiana. What's really fascinating about this is that, unlike in some plains states like Nebraska, it's not because the only cities are in the east, but it seems to be a near universal trend across the state. Rural counties in the east tend to be Republican leaning or toss-ups, while in the west they are 70-30 and 65-35 Bush counties. The same is true for cities, as Cuyahoga county and Cleveland are Democratic in the northeast, Columbus is only pale blue in the centre of the state, in the west Dayton is a tossup and in the southwest Cincinnati trends red.
The main Democratic areas are cities, namely Cleveland in the northeast, Youngstown on the Pennsylvania Border, and Toledo in the northwest. Republicans blanket the west of the state, as mentioned above.
Counties to watch: There are two main swing areas, plus a couple of other counties to keep your eye on. The first are the white counties in the east of the state, just south of the darker blue Cleveland area, Stark and Columbiana Counties, containing Canton. These edge Democratic, and while Kerry split them, Gore won neither. An Obama win in both is a good sign, a split could mean another very tight race. The second are the two white counties surrounded by red in the west of the state. The westernmost is Montgomery County, home to Dayton and usually about a point or so Democratic, while the eastern one is Clark County, where Springfield tends to vote right with the state as a whole.
Some other areas to watch are the swing counties adjacent to Toldeo in the northwest and Cleveland in the northeast, and the small southern swing counties Scioto and Pike. Kerry won none of these counties, but was above 47.5% in all of them. Obama will need to flip at least one or two to take the state, and if he has them all, or big leads in a couple, he could breeze to a win.
As many as five house races could be close, with three looking like very good pickup chances, and four of the five are in the more Republican southwest area, though not the deepest red areas. OH-01 features 7th term incumbent Steve Chabot in trouble, with Democrat Steven Driehaus pushing in the heart of Cincinnati. This is a Republican area, but high African-American turnout in the city itself will help Driehaus. Mean Jean Schmidt is under pressure in OH-02, which stretches east from Cincinnati to those to southern swing counties that Obama and Victoria Wulsin may be counting on. The other three are open seats, with OH-07 stretching between the two white swing counties east of Dayton, OH-15 featuring a big chunk of the Columbus area that should favour Kilroy, but also the two deep red counties to the west, and OH-16 in the northeast part of the state, extending from a eastern bound of the swing county of Stark, or Canton, to the brick-red county to the west
Where the people are: I've mostly covered the cities, but I'll run through them anyway. About 12% are in the direct Cleveland area, but when the cities in the northeast such as Akron and Youngstown are added in, more than a third of the votes will come from this area. Toledo in the northwest has ~5%, Columbus about 9% and the Dayton-Cincinnati area in the southwest around 20%.
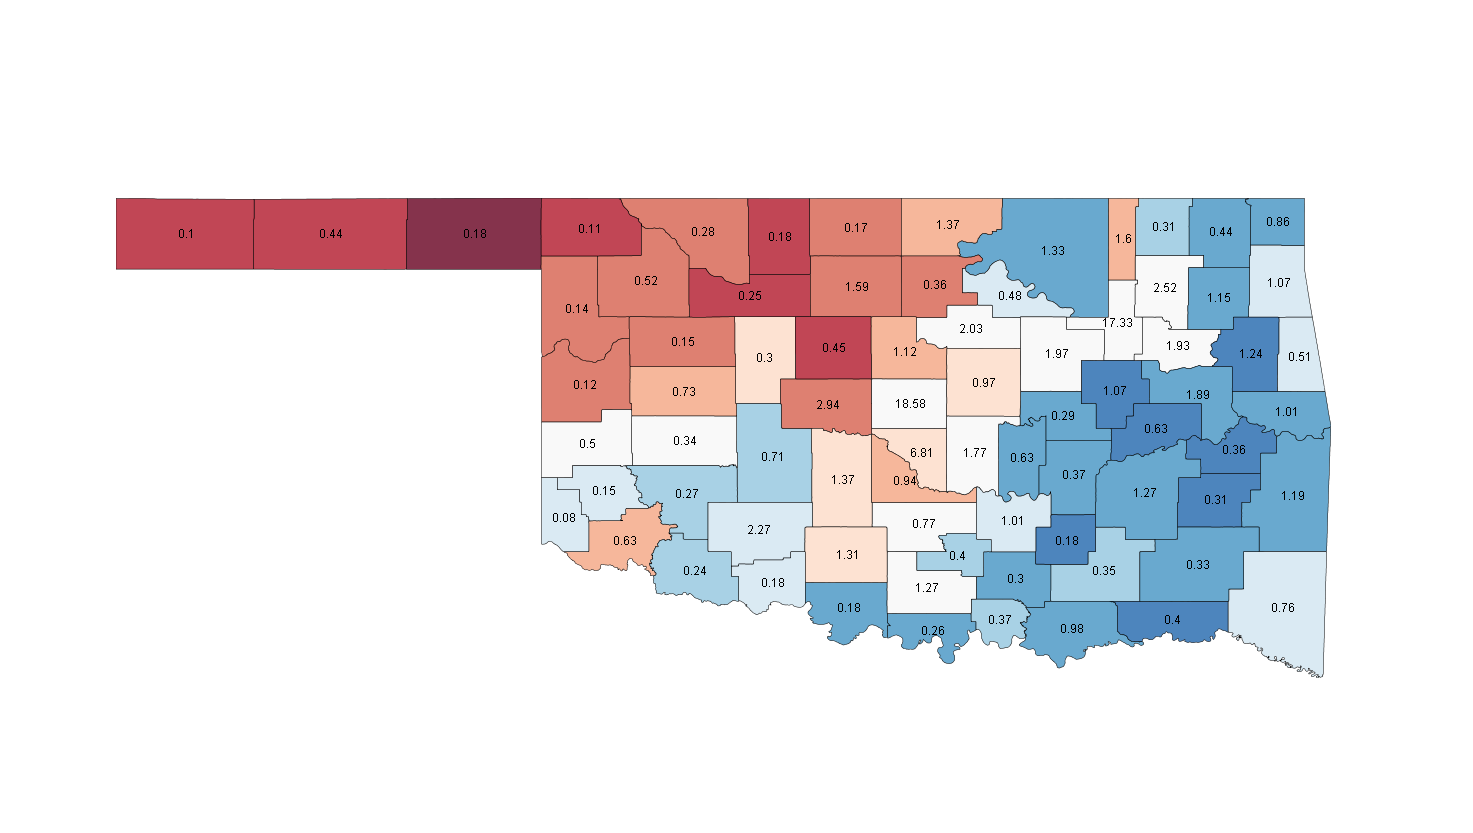
OKLAHOMA
This page includes a map of county names
Races (538 Average/SSP Rating): President - Safe McCain (O 36.9, M 62.8) Senate - Safe Republican (D 41.1, R 56.3) House - None Close
O2B senate candidate Andrew Rice would love to see this kind of map on Tuesday, but given that he seems to be back by double digits, it will be very difficult. A recent poll had him down just 10, his closest of the last few months, but a similarly timed SUSA poll had him down 22. It was tough to even find if this is what a Democrat at 50% in Oklahoma looks like, but it seems accurate, based on Brad Henry's 6900 vote 2002 Gubernatorial win. Note that the blue counties in the east are not deep blue as in some red states, and this is because John Kerry was unable to carry a single county in the entire state, and Obama will be under pressure not to do the same thing, serving as a huge anchor to Rice. If he does win a county or two it will be in the heart of the blue area, where one of the more unique demographic alliances occurs for Democrats, with counties typically featuring double digits of African-Americans and aboriginals. This is one of the few states that the two groups live in reasonably large numbers in similar areas, at least to my knowledge. However, there just aren't enough of either group to make the state competitive on a Presidential level.
Counties to watch: At first, this seemed to me to be basically coincident with the 'where the people are' section, as the key areas that drive the state's average result are the two largest areas, the cleverly named Oklahoma County (home to Oklahoma City) and Tulsa County. However, when Brad Henry won the Governor's Mansion in '02, he lost in both these areas by 10 points. Henry made up for this weakness, though, by taking many of the surrounding counties and pushing hard into the swing areas in the southwest. However, this race did have a 14% independent who was fairly strong in the cities. Whether this path to victory is something particular to state-level races, due to turnout changes in mid-term elections, or just a weird sort-of three way race I don't know, but it looks to me like if Andrew Rice is down 10 in Tulsa and Oklahoma City, he'll be in some big trouble.
Where the people are: Oklahoma City contains nearly 20% inside the county itself, with another 9% in the surrounding areas. Tulsa is smaller, just 17%, but has around 12% of the vote in the nearby area, making the two areas quite similar in size.
OREGON
This page includes a map of county names

Races (538 Average/SSP Rating): President - Safe Obama (O 56.5, M 41.9) Senate - Likely Democratic (D 50.6, R 46.2) House - OR-05, Schrader v. Erickson (Likely D)
The most recent SUSA poll of the state suggested that Barack Obama already had nearly 45% of the statewide vote banked, thanks to Oregon's vote-by-mail system. He can lose 4 of 5 voters who haven't voted yet and still win the race. The same is not true for Senate candidate Jeff Merkley, who polled 12 points lower from opponent Gordon Smith. The good news is that he is still polling ahead, and most of the remaining voters say they are Obama/Merkley.
Al Gore won the state by 0.4%, and John Kerry by 4%, but they both won the same 7 counties, the five most northernmost, including the deep blue of Multnomah County, a 70-25 Kerry county containing Portland, and the three blue counties at the Pacific coast about halfway up the state. This looks like it could easily be the result for Merkley as well, with perhaps the only flipping county being the white county on the coast, Tillamook. With a 15 point margin, though, Obama looks set for a map that looks more like a Perot-aided Clinton '96, pushing to the west of Portland and also into Jackson County and Medford in the south of the state.
Counties to watch: The four white coloured counties around dark blue Portland are the key, especially the two largest, Washington in the east and Clackamas in the west. Gore and Kerry both got away with losing Clackamas and the county on the coast, Tillamook, but the margins were less than a point of Gore and less than two for Kerry. The other two swing counties in the area typically favour the Democrat slightly. If Merkley is winning the eastern three or all four, he is in very good shape for the win. If he is losing either of the central two, he is in some trouble. Even with wins in two or three of the swing counties, though, margin matters, especially if there are many Smith-Obama voters in these areas, which have favoured Smith somewhat in the past.
The interesting House race should be a Democratic hold of an open seat in OR-05, which streches from Clackamas county through the two light red counties to the west, then widening to encompass Tillamook and the southern blue county, Lincoln. Kurt Schrader should hold the seat, building his margins on the coast and the Portland area.
Where the people are: More than 50% of the vote comes from Portland, and just to the south in the light red area, Salem. A further 10% is in Lane county, home to Eugene. Less than 5% of votes are in the brick and deep-red areas in the rural east.
PENNSYLVANIA
This page includes a map of county names

Races (538 Average/SSP Rating): President - Safe Obama (O 53.6, M 45.1) Senate - None House - PA-03, Dahlkemper v. English(i) (Toss-up), PA-04, Altmire(i) v. Hart(Likely D), PA-08, Murphy(i) v. Manion (Likely D), PA-10, Carney(i) v. Hackett (Lean D), PA-11, Kanjorski(i) v. Barletta (Toss-up), PA-12, Murtha(i) v. Russell (Lean D), PA-15, Bennett v. Dent(i) (Likely R)
Pennsylvania has famously been called by James Carville "Pittsburgh and Philadelphia with Alabama in between". I don't really feel that's fair, at least in Alabama Democrats can actually win some counties. But we know what Carville means, and he's right that the majority of counties between the two major areas of Democratic strength, dark blue Philadelphia in the east and lighter blue Pittsburgh in the west, are at best 60-40 Bush, with many of the darker ones at least 75-25 Bush counties.
But is this really that remarkable? While it's true that the centre of Pennsylvania is more Republican than the centre of a state like New York, it would probably also be accurate to say that a state like Oregon is Portland with Alabama stuck on the eastern end, or Nevada is Clark County with Alabama stuck on the north. This is just how Democrats win, and while Pennsylvania is a little redder in the middle than a Northeastern state, it doesn't look that much different than other Midwestern states.
But the real point that Carville is implying is the presence of racism, more typically associated with the south. But does racism show up politically? We fortunately have a good example of a black candidate running state-wide, as Lynn Swann ran for Governor in 2006. Even better, he ran as a Republican against white Democrat Ed Rendell, a perfect case study for these 'racist' rural voters to jump ship for the Republicans and vote for Rendell, or even stay home, with the strong Democratic wave across the nation.
Swann got 40% statewide. My models, which don't include data from this race, so they're not biased towards the real result, predict Swann would get 10% in Philadelphia County, around 35% in Allegheny County, Pittsburgh itself, and around 60% in the dark red counties in the south of the state, with about 50-55% in the brick red counties around them. This is pretty much exactly what happened, with the exception that Swann was a little stronger than expected in the Pittsburgh area where his name carried the best cachet value. In Perry County, the dark red county labeled 0.34 that stretches east to west near the south of the state, Swann beat Rick Santorum by a couple of percent. Shockingly Swann beat Arlen Specter's 2004 % by a point or so. And Specter won the state! So my take-away is that if racism exists, I didn't see it, at least in that race. I think the polling will be fairly accurate, as it was for Swann, and Obama will win the state handily.
Counties to watch: But to win the state, a Democrat doesn't need these central areas, but can get by by winning the western edge and the southeastern corners of the state. The most important areas to watch are the eastern swing areas around Philadelphia, Bucks County to the direct east, and Lehigh and Northampton Counties just north of that. Kerry won these by 2-3 points, just like the state itself, and the same is true for Gore. If Obama has steady leads in these areas, he should walk to a victory in the state. The swing areas to the west of Pittsburgh tend to run a point or so behind the Democrat, so a close loss is not a disaster, but a win is a very good sign. These western areas are not as populated, and are thus not quite as key to a win, as John Kerry found out.
There are a number of interesting House races, but these are actually mostly Democrats working to hold fairly Republican areas. PA-03 is a takeover chance, a district in the northwest corner with some tendrils reaching into darker red counties to the east. The key area here is the northern-most county, Erie, which is just short of the cusp of looking Democratic blue. Jason Altmire should hold PA-04, which covers part of the Pittsburgh area, along with the pale blue and swing counties to the west. PA-08 is coincident with the swing county of Bucks in the Philadelphia area, and should be a hold as well. PA-10 is some tough Democratic ground, taking up the red northeast corner of the state, but only part of the blue county, Scranton, in the area. This district actually wraps south around to the closest dark red county to the southwest. PA-11 are all those hard-working types you keep hearing about, part of blue Scranton and it's neighboring areas, included white swing county Luzerne, home to Wilkes-Barre. Jack Murtha may think he has 'racist' constituents, but this is the area were Swann outperformed expectations in 2006, and the question is if Murtha will be in trouble in PA-12, which starts in the southwest corner, and goes north-west before splitting and curling around to touch the areas east of Pittsburgh and the white swing county well east of Pittsburgh, Cambria. Finally, PA-15 is a the second potential pickup, covering the two swing counties north of Philadelphia discussed above.
Where the people are: 12% of votes are in Philadelphia County, and a further quarter are in the surrounding areas. Pittsburgh and its environs have another 17% or so.
RHODE ISLAND
This page includes a map of county names
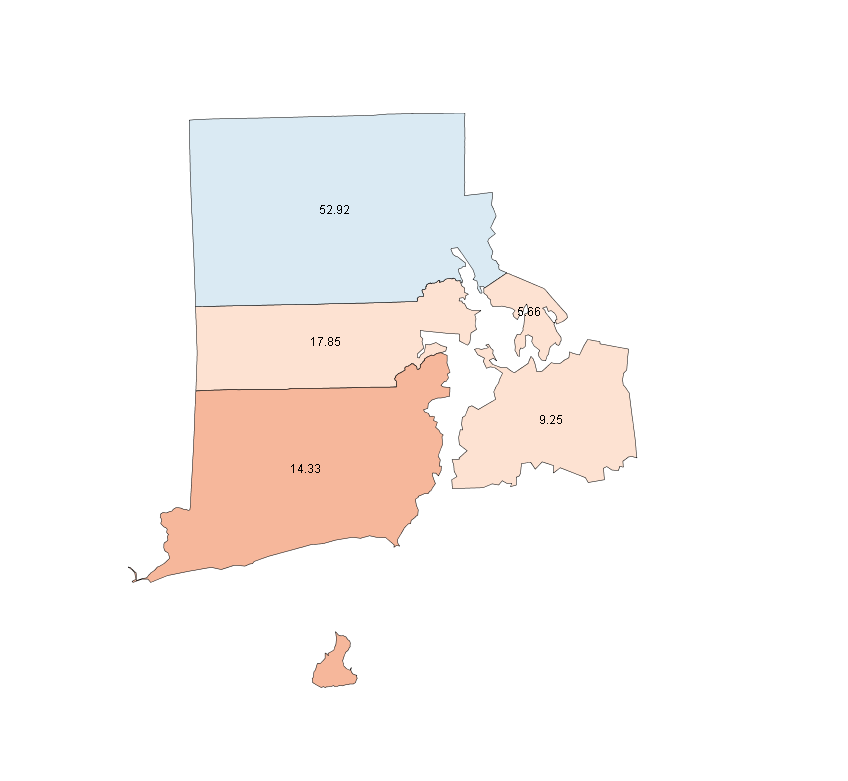
**Just as with some other states, the Census messed up the islands here. I fixed it enough to be vaguely recognizable, rather than just big round blobs, but it's still pretty rough, so forgive me.**
Races (538 Average/SSP Rating): President - Safe Obama (O 59.4, M 36.9) Senate - Safe Democratic (D 73.3, R 24.1) House - None Close
Finally, a state with no compelling drama at all. Sorry, Rhode Islanders. A Democrat hasn't lost a county here in my lifetime, the last being Reagan's win of the state in '84. We do know what a close race looks like in the state, though, and the Whitehouse-Chafee Senate race, along with the Carcieri-Fogarty Gubernatorial race in '06 both look just like this, with Republicans winning the southern four counties, the pale three by a couple of points, and the southern one, Washington, by as much as 10. Providence then proceeds to erase these Republican margins with 60-40 Democratic votes. In presidential contests, it's not even that close.
Counties to watch: None really. Don't watch Rhode Island. Sorry. But if you do end up watching it, or live there, watch the north of the state. Bristol on the east runs a little Republican, and Providence a fairly Democratic, but these are probably the most comfortable predictors of the margin. If Obama is up by 20 or more in these areas, then you'll know the polls had the right call.
Where the people are: More than half of the votes come from Providence, giving it only modestly less pull over state results as Maricopa in Arizona or Clark in Nevada.
SOUTH CAROLINA
This page includes a map of county names
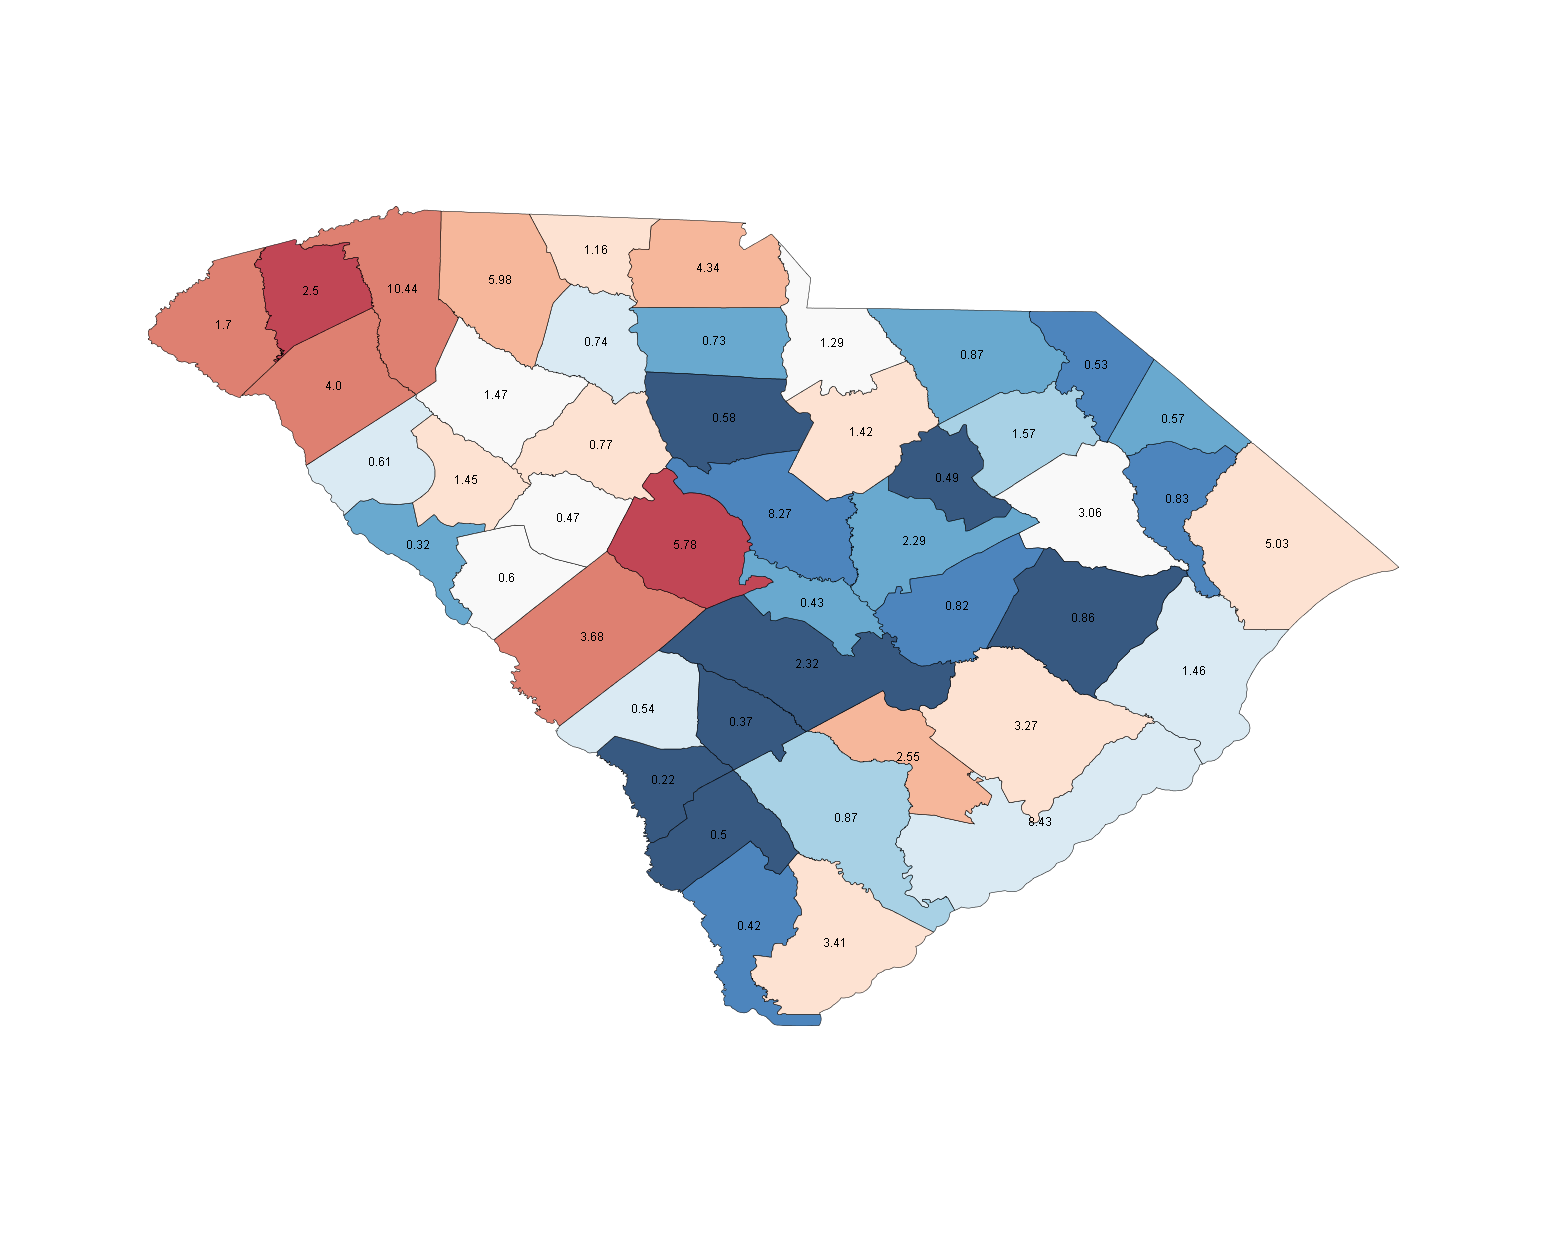
Races (538 Average/SSP Rating): President - Safe McCain (O 44.1, M 55.0) Senate - Safe Republican (D 40.1, R 56.7) House - SC-01, Ketner v. Brown(i) (Lean R)
This is not a battleground state, but should be a state with an improved margin for Obama compared to the 40-60 losses Kerry and Gore took, but not by much. Bob Conley, a Democrat in name, but with a very non-traditional Democratic policy set, was at one point within single digits of Lindsey Graham, but has fallen off since.
The counties that Gore and Kerry won will likely go to Obama as well, who will be unlikely to flip more than a few others. In a development that shouldn't surprise people who've seen maps of North Carolina and Georgia, the Democratic counties are primarily African-American, and run north through the centre of the state. The problem for Democrats is that with the exception of Richland County, in the centre of the state, most of the larger areas are significantly more Republican. The more rural majority-Black districts just don't build up enough margin to get Democratic candidates over the top statewide. The good news for Democrats is that the coast is not as Republican as North Carolina, but the interior of the state is quite red, including Greenville County in the northwest.
Counties to watch: If a Democrat wants to be within double digits, the pale blue counties on the coast, the Charleston area, are necessary wins. For a state wide win, there has to be a pretty good margin in these counties too. Democrats trailing here have no realistic shot state-wide.
The one tightly contested House seat, SC-01, stretches down the northern edge of the coast, covering the pale blue counties of Charleston, and also the pale red in the northeast, which includes Myrtle Beach. Democrat Linda Ketner will have to make hay in the western blue part of the district to win the seat.
Where the people are: Around 15% live around the Democratic areas of Columbia, though one of the counties around here is pretty deep red. The other main areas are Greenville in the Republican northwest and Charleston on the coast. Greenville has around 20% of the vote in its surrounding areas, with another 13% or so in Charleston.
SOUTH DAKOTA
This page includes a map of county names
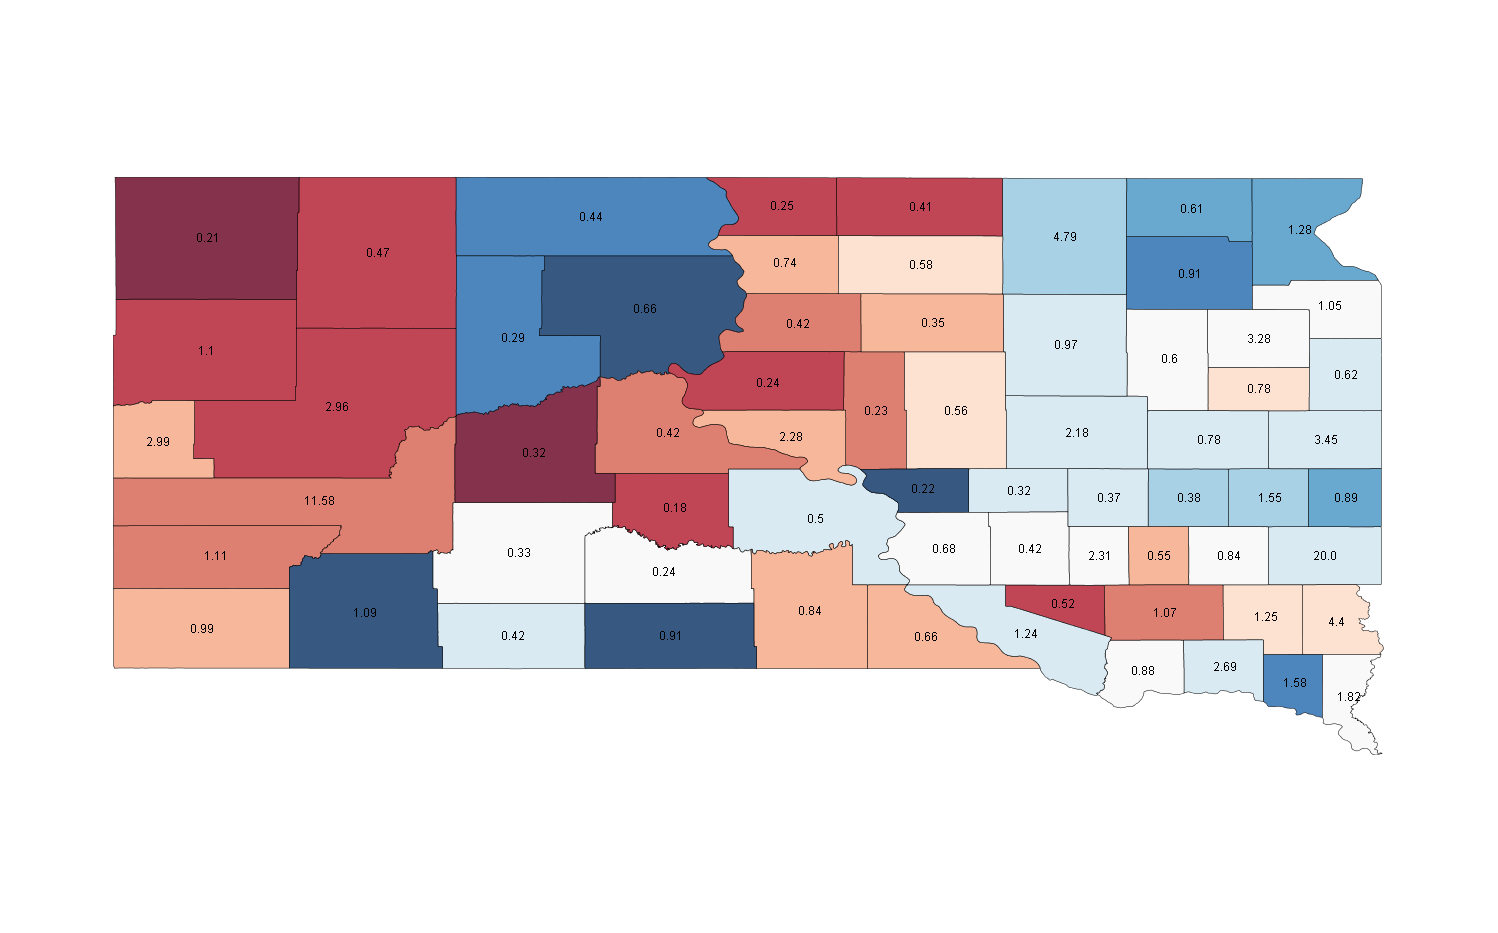
Races (538 Average/SSP Rating): President - Safe McCain (O 44.1, M 53.7) Senate - Safe Democratic (D 61.0, R 36.3) House - None Close
For the first time since the '92-'98 cycle of Senate elections, South Dakota should have a very safe hold, for Tim Johnson. The overall map is very reminiscent of North Dakota, with some slight differences. The state is on average more Republican, making the blue areas a little darker than in the North. Just as in the North, the dark blue areas in the west of the state are mostly within or contain reserves, and make up a slightly larger fraction of the voting population and general area than in North Dakota. Many of these deep blue counties were 60-40 or 70-30 Kerry counties, with Shannon County, the furthest west, an 85-15 county, and a 92-8(!) Johnson County when he beat John Thune by 500 votes. In that win, Johnson got a margin of 2600 votes from Shannon alone, 5 times his victory margin.
Counties to watch: However, winning in this state requires a winning the white vote as well, and this must come from the light blue and white swing counties in the east. Of these, Codington County in the north, labeled '3.28' is typically a 40-60 county at Presidential level that Obama must get closer to be close. Another area is Sioux Falls (not Sioux City, Barack!) in the southeast, pale-blue and labeled '20.0'. This is 55-45 Bush territory, that, if Obama can get ahead in, can make the state interesting. This seems unlikely, though. Also watch for the O2B supported South Dakota Campaign for Healthy Families, which is fighting to keep the right to choose for women. In 2006 a similar ban attempt failed, but it is important to note that the ban looks somewhat different than the Democratic map, as last time the ban largely lost the red Western (!?) part of the state, but won in the swing-ier southeast section. Also not that the 75-25 support for the Democratic candidate in reserve areas did not extend to the '06 ban, as these counties still voted no, but shed 10-15 points of the support given to the statewide house race for Stephanie Herseth.
Where the people are: More than 25% are in the area around Sioux Falls, while the other high-population area of the state lies at a similar latitude, but in the west, the medium-red area of Rapid City, with another 15% of voters in the area.
TENNESSEE
This page includes a map of county names
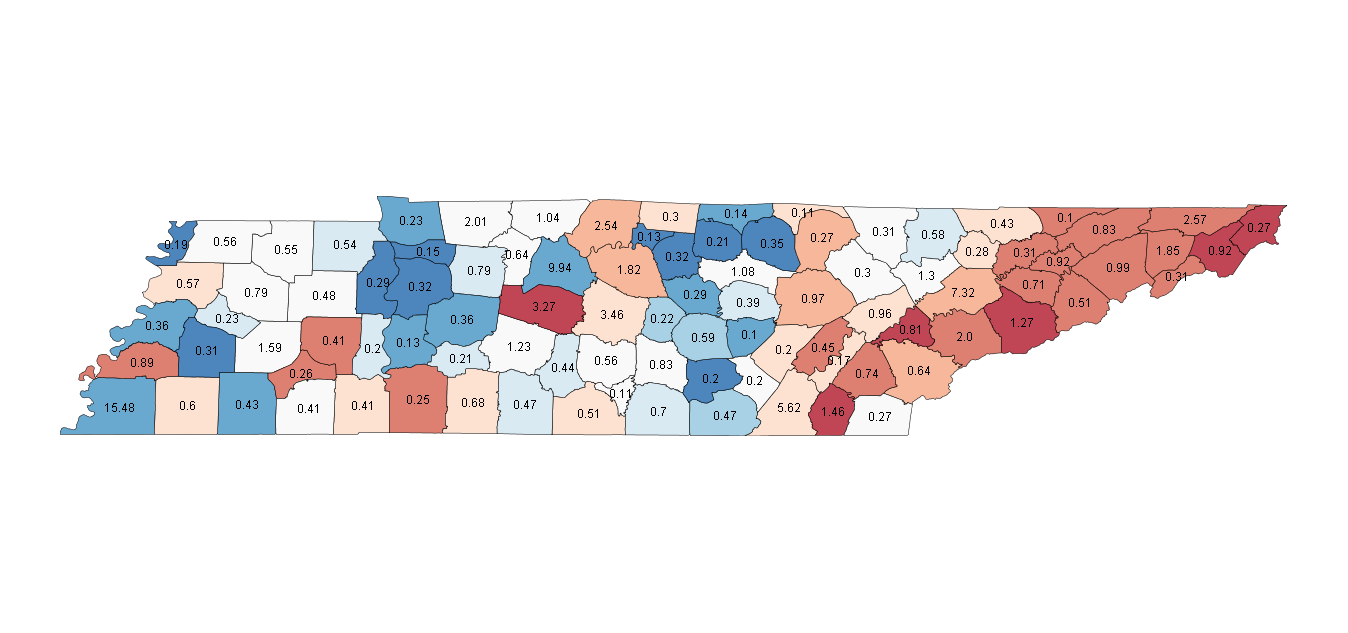
Races (538 Average/SSP Rating): President - Safe McCain (O 42.0, M 56.7) Senate - Safe Republican (D 35.8, R 61.9) House - None Close
This is a state where Barack Obama could under-perform John Kerry, a fairly rare feat in this election. Looking at Harold Ford's 2006 Senate race, this makes sense as a 50-50 Tennessee election, but we won't see one of those this time around. As I mentioned in Kentucky, the interesting areas to watch are the heavily white, but heavily Democratic areas in the centre of the state, a relative rarity in the south. This is the Upper Cumberland region, just on the edge of the Appalachians. Kerry won these counties being about as un-Southern as you get, and the question is whether race will move these counties more Republican than usual. My first thought is that they won't but when you here talking heads going on about racism in voting, here is a good place to look. Other than that, watch for the Democratic candidates to narrowly win the cities in the west and centre, and to get wiped out in the east.
Counties to watch: With no close races, there isn't much. To get a feel for the state margins, watch the swing counties in the western end, which is more African-American than the eastern and central parts of the state. If Obama has good numbers here, this may translate well to rural, partially Black areas in the Carolinas, Georgia and Virginia as well.
Where the people are: Four areas hold a solid chunk of the state's population. Shelby County in the southwest is Memphis, with around 15%. Right in the centre of the state, the adjacent blue and red counties are Nashville, home to another 13% of the vote. Chattanooga and the area near it in the south-east has around 7%, and just where the eastern end of the state begins to turn dark red, Knox County and Knoxville are a solid Republican area.
So that's the fourth set of 10 states, only a few to go! Hope you enjoyed it, and check out my earlier, and eventually the final, part of the series.