Hi, everyone. One of my favourite parts of any election night's coverage on CNN is 'the big board', specifically when John King goes through a race's results and boldly proclaims "This is where the people are". Also, there is nothing quite like the drama of a statewide race in Missouri where the Republican is 5 or 6 points up, but you can see St. Louis is still out...
PART 1 HEREPART 2 HEREPART 4 HEREPART 5 HERE
**If you read the earlier entry in this series, the introduction below is identical, so you can just skip to the maps**
PART 1 HEREPART 2 HEREPART 4 HEREPART 5 HERE
Also, please drop by visit for the guys at Stochastic Democracy It looks like I'll be doing some live-blogging over there during Election Night, and they're looking like having a really cool system for calling elections that any numbers buff should check out.
However, other than the basics of 'Democrats live more in cities', it's tough to really get a sense of how a race is going to unfold based on what's shown on TV, especially when an important race in the Senate, of which there are several, get fairly little attention in the wake of a Presidential call.
So, I decided to try and help out myself, and by posting this, other Daily Kos readers, by calculating, for every county in the country, a partisan voting index. Think of this as the same as a regular PVI, only at a county level, relative to the overall state result, rather than at the CD-level relative to the overall national result. To do this, I took the results for the Democratic candidate in each county for the last two presidential races and the last two senate races and calculated by how much they differed from the overall state result for the Democrat in the same race.
For example:
2006 VA Senate - Statewide, Webb 49.6% - Rappahannock County, Webb 51.6%, for a rating of +2.0%
By averaging the results from these four races, weighting for the more recent, and weighting the Presidential race over the Senate races a little, I calculated each county's Blarghman County Voting Index (BCVI).
What does this mean, you ask? Well, basically, what it means is that as results come in, you can look at the BCVI values, or more appropriately, the maps I have created that show them, and figure out if the results yet to come favour the Democrat or the Republican. Also, they can give you an early idea of how a candidate is doing.
As in the example above, consider, Rappahannock County, VA. While it was 2 points more for Webb than the state overall, when the other races are factored in, it is about even with the state average. This is reflected in the fact that John Kerry earned 45.4% in the county, and 45.5% in the state.
So, if Rappahannock reports fairly early on Election Night (purely speculation on my part), and Obama is above 50%, it's a very good sign that he will have a good chance at winning the state. To me, this is fascinating stuff, and can really give a lot of input to avid political viewers like myself and many others here.
So, with just a little further ado, I am going to present some maps, along with some brief discussion, of the first 10 states alphabetically, with the maps shaded by BCVI value.
**IMPORTANT NOTES ABOUT MAPS AND ANALYSIS**
- Remember that these are a voting index, not a vote total. The maps depict how far from a STATE AVERAGE a Democrat is expected to be in a given county.
- These are based on data from past elections, and do not consider changes in turnout pattern in this election, nor demographic shifts since the last election. I don't see any way to realistically model these, so I must unfortunately ignore them.
- The number on each county represents it's percentage of overall state 2004 turnout, to give you a rough idea of, as John King puts it, "Where the people are".
- I don't live in any of these counties, and I never have, I'm a Canadian citizen, who is fascinated with the mathematics, statistics, polling, drama and scope of US elections. So if you have something you know about your area that I've mischaracterized, please let me and others know in the comments, and I'll try and fix it.
- Note, unsurprisingly, the deeper red indicate more Republican areas, with the deepest red indicating a Index value lower than -20. The same is true for deepest blue and Democratic counties above +20. White indicates counties that are plus or minus 2.5 from the state average.
- To see a map bigger, including the numbers at much higher quality, at least in Firefox, right click and select 'View Image'. For IE, I think you have to choose 'Save Image', then view it once you've downloaded it.
- Really, this is #1 again, but you can basically consider these maps as a 50-50 scenario, ie. "what if the Democrat and the Republican tied in state X?". For some blood-red and ocean-blue (what else is deep blue, anyone got anything?) states, these will look strange, if only because we aren't used to seeing maps where a Democrat is anywhere near 50% in, say, Idaho.
So, once more unto the breach we go. Starting from the land of ten thousand lakes...
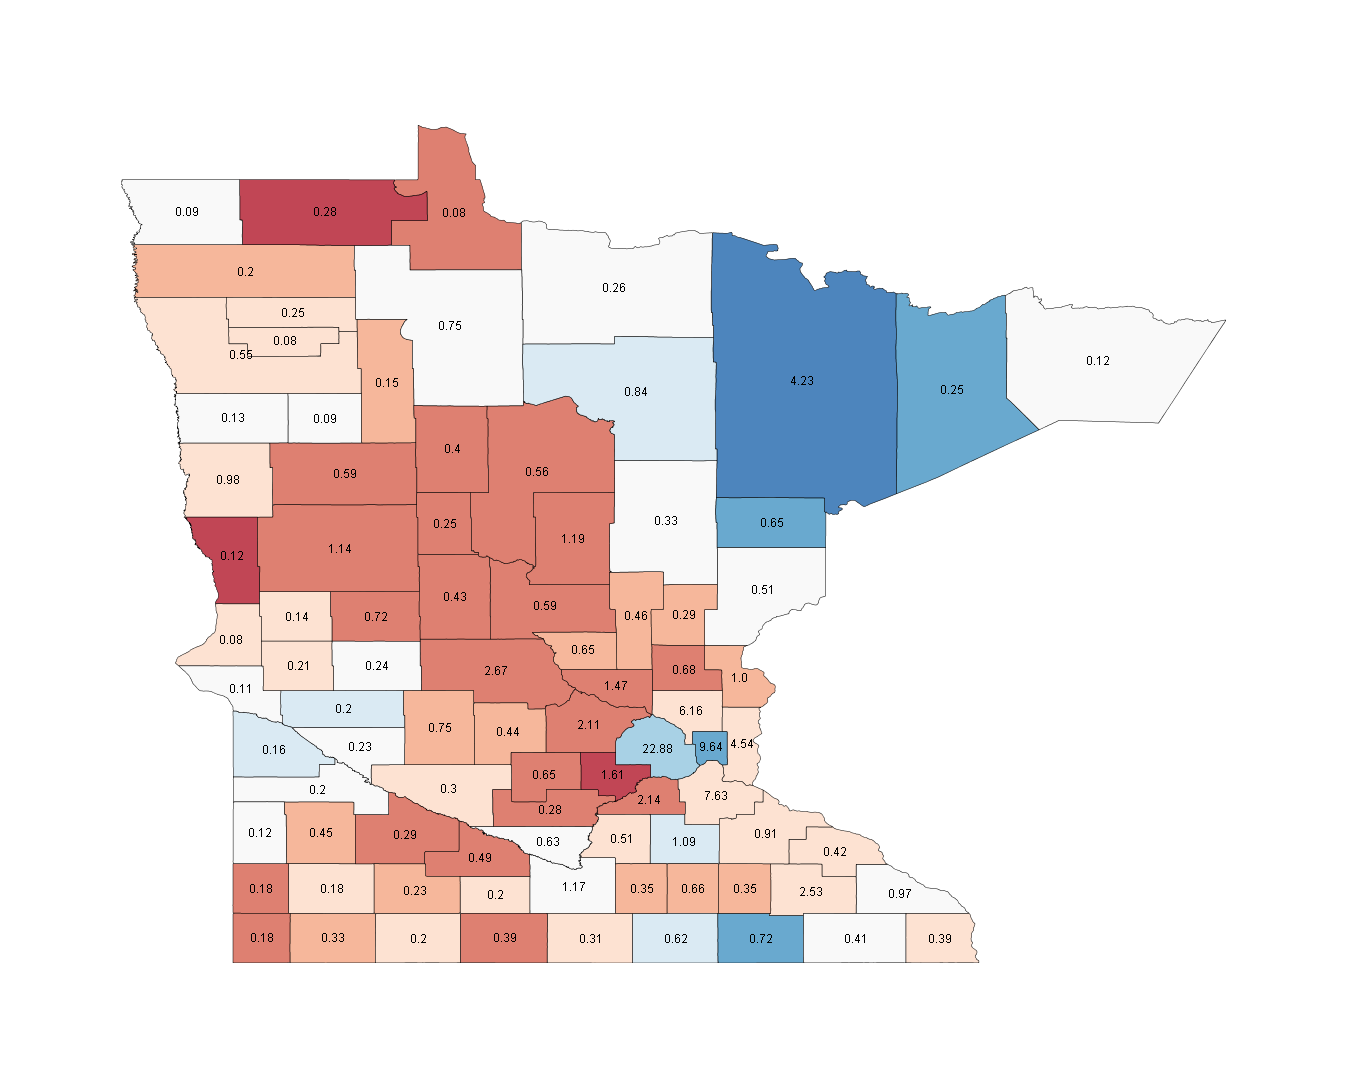
MINNESOTA
This page includes a map of county names
Races (538 Average/SSP Rating): President - Safe Obama (O 53.8, M 44.4) Senate - Toss-up (D 47.5, R 46.8) (538 does not have an Independent estimate) House - MN-01, Walz(i) v. Davis (Likely D), MN-03 Madia v. Paulsen (Toss-up), MN-06 Tinklenberg v. Bachmann(i) (Toss-up)
Minnesotans might be privy to the closest Senate race in the country, as radio host and O2B candidate Al Franken takes on not one, but two opponents, in sitting senator Norm Coleman and independent Dean Barkley. The good news for Democrats is that Obama should be safe, but the senate race could go to either of the two main party candidates. Barkley briefly held this very seat after the tragic death of Paul Wellstone, but did not contest the Mondale-Coleman race that followed.
First, a quick discussion of party strongholds. The two smaller blue counties in the east, Hennepin and Ramsey, are Minneapolis and St. Paul, and they are comfortably Democratic, delivering around a 60-40 Kerry vote in an overall 3.5 point win. The other key Democratic area is the large blue counties on the eastern 'peninsula'. The largest and darkest is St. Louis County, home to Duluth. When Republican Arne Carlson earned re-election to the governor's post in 1994, those three blue counties were the only Democratic ones in the state. In contrast, there are no deeply Republican areas, just moderately so. There were a few 70-30 Bush counties, but only two or three, and they tend to be more favourable to senate candidates. The major one is in the southeast part of St. Paul, Carver County.
An important thing to realize about Minnesota is the strength of the independent vote, as we can see in the Senate Race. Nader had 5% in 2000, Perot had a quarter of the vote in '92, and of course, Jesse Ventura was governor. While Barkley is a wild card factor, though, we do know that he has run for senate twice before. In those races, his support came most strongly from the areas around the Twin Cities. While Barkley ran above average in Hennepin and Ramsey Counties, his strongest showings came in the pale red and white states ringing the main population zone, especially to the northeast. Overall, it's not clear to me at first blush if he hurts Democrats more than Republicans, but given that his numbers are lower in the more Republican west and northwest, it seems a strong possibility.
Counties to watch: A few groups here for a tight race. The first is the white counties just west of the large blue area in the north, Aitken, Beltrami, Pine and Koochiching Counties. These tend to run around a point or so behind the Democrat state wide, but I haven't seen a map for a Democrat who won without at least one or two of these counties. The southern ones are prime Barkley territory, so watch to see what kind of numbers he pulls and who from. Beltrami is notable for being 20% aboriginal, and it will be interesting to see if the outreach Obama has attempted in states like New Mexico also will happen in Minnesota, and whether it can benefit Franken at all.
The second group are the white counties to the south-west of the state. Of these, Big Stone county, the furthermost west, is a strong predictor of the overall result. A winning Democratic map typically has a cluster of a few blue counties surrounded by the red counties ringing the area.
Finally, watch Blue Earth and Nicollet counties, just southwest of St. Paul. Again, these run a little behind, and a Democrat can win without them, but if the range here is more than a couple of points, to the Republican, Franken is in trouble.
The last two groups are generally poor to average Barkley areas, but if Barkley is as high as 15%, which would be his best state-wide showing, things could get chaotic.
In addition, no less than three house races will occupy our time in Minnesota. The big one on dKos and the netroots in general is, of course, MN-06, where many Dems are hoping for a takedown of Michelle Bachmann. MN-06 rings around the top half of the two blue counties that make up the Twin Cities, and tails off to the west, stopping halfway through Stearns County, the sort of Nebraska shaped county labelled 2.67. The good news for El Tinklenburg is that much of the vote is in the more Democratic friendly east, while the western areas, which were 60-40 Bush counties in general, are also smaller.
In MN-01, covering the whole bottom half of the state, Tim Walz should hold his seat. He will be keying on the southern Democratic areas, as well as the two southern swing counties mentioned above. In MN-03, Ashwin Madia is in a tight race to take the seat, which is located in light blue Hennepin county. The good news is that if the polls are correct, this should be at least a 60-40 Obama area, and that can only help Madia.
Where the people are: Mostly in the Twin Cities, as mentioned above. More than 50% of the vote will come from the two blue counties and the pale red ring around them. Duluth, in St. Louis County, is the other main vote area.
MISSOURI
This page includes a map of county names

Races (538 Average/SSP Rating): President - Toss-up (O 49.4, M 49.1) Senate - None Governor - Nixon v. Hulshof (Likely D) House - MO-06, Barnes v. Graves(i) (Lean R), MO-09, Baker v. Luetkemeyer (Lean R)
This state was the inspiration for this diary, as in both 2006 for Claire McCaskill and the 2008 primaries for Barack Obama, late reporting St. Louis results pushed a candidate over the top in a come-from-behind upset. In the primaries, the AP was even fooled, despite the fact they should have seen it before from 2006.
Given this, I guess I was under the impression that Missouri was sort of like Illinois, in the sense of "win St. Louis and Kansas City (darker blue in the east and west, respectively), and a couple of other counties, and you can take the state". Looks like I was dead wrong in my reckoning, because John Kerry had that map in 2004 and lost by 7 points. The key difference between Missouri and Illinois is that St. Louis and Kansas City are strong Democratic, especially the city of St. Louis proper, but not Chicago strong, especially St. Louis County, which was a 55-45 Kerry county. Good, but not great.
What really gives you this impression is, of course, the extremely late counting of votes in the areas of St. Louis County that are the strongest Democratic. At the time of the AP's call of the Clinton primary win, Obama's lead in St. Louis County (note, not the city itself) was around 55-45 with half counted. It ended at a near 30 point margin, 63-36. Claire McCaskill faced a similar late shift in her Senate Race. So, remember, that even if St. Louis County is at or behind Kerry numbers with a good chunk in, the last numbers in will likely favour Obama strongly enough that a gap of a couple points can be made up.
However, as I mentioned, winning in the cities is not enough. In close races, a Democrat generally has to win at least two of three other areas I'll discuss here.
Counties to watch: The first area is the sort-of "whiskers" to the far southeast, Mississippi, New Madrid and Pemiscot Counties. They get more progressively Republican as you move north, but these three counties are key to Democratic hopes. Kerry lost all three, while Gore won them and kept the election close.
The other key for a Missouri winner is what I like to think of as 'outstretched arms'. Essentially, a Democrat who wants to win in Missouri should be able to create a nearly contiguous line between St. Louis and either Oregon County, the pale red county on the flat portion of the southern border, or through to Kansas City, taking a couple of skips on the way. If a Democrat can be strong in St. Louis, make one connection and get close to another, they can win the state. McCaskill and former senator Robert Holden made the bottom connection and got close on the top, while Mel Carnahan came close on both, and all won. Gore has the traces of a connection to Kansas City, but wasn't strong enough in the KC area.
The final piece of the puzzle is the Kansas City environs, which are major swing territory. The four white counties just north of KC all went against Kerry but for McCaskill. If Obama is even in these it'll be close, but if he wins them he has a very good shot.
O2B candidate Judy Baker is competing in MO-09. This is a large district that covers much of the northwest corner of Missouri, and stretches as far south as the southern edge of the St. Louis area, but stays on the eastern border of St. Louis itself. The largest county in this district is the light blue, 2.78 labeled Boone County, home to Columbia. This area on the western edge of the district is where Baker must build up votes to win the race. MO-06 is another Republican district that goes from the Northeast corner down to Kansas City, again stopping short of the city proper, but including the four swing counties highlighted above. It also stretches east to border the 9th district. This battle will likely be fought and won in the areas around and in Jackson County.
Where the people are: My most recent diary is the top search result on Google for "win where the people are" with quotes, just ahead of a CNN transcript where John King says "win, where the people are". Even if he's never said it about Missouri, this combination inspired my viewers guides.
The people are in Kansas City and surrounding areas (around 20%), and in St. Louis city, County and the surrounding counties (around 35%). Now you know, if you didn't before.
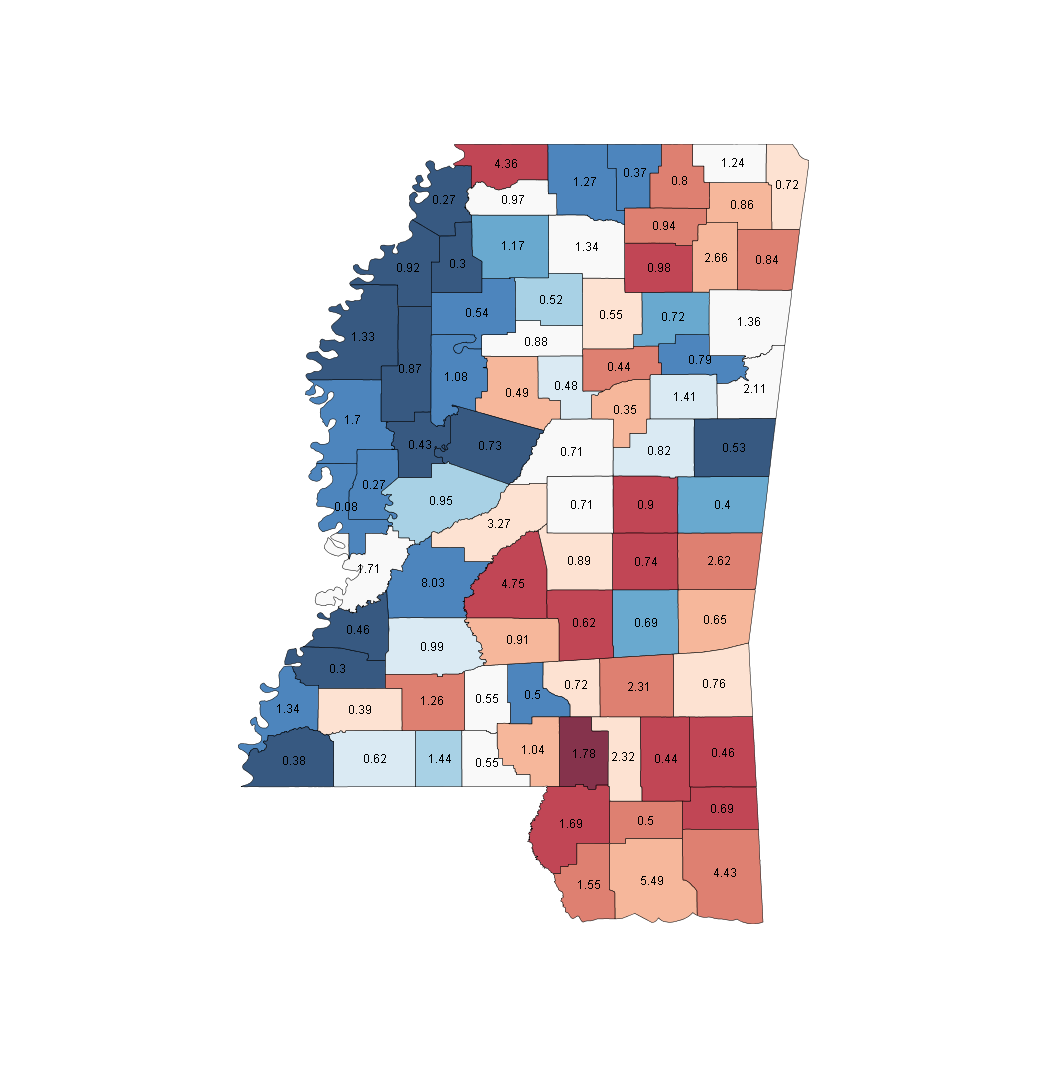
MISSISSIPPI
This page includes a map of county names
Races (538 Average/SSP Rating): President - Safe McCain (O 44.1, M 54.0) Senate A - Safe Republican (D 53.6, R 62.0) Senate B - Lean Republican (D 46.9, R 50.3) House - MS-01, Childers(i) vs. Davis
Well, this looks like a pretty cut and dry state, but I have a few thoughts about the one competitive race, the Senate special election. First off, though, some comments about the state in general. Obviously, Mississippi has a very classic southern state pattern of many fairly small, heavily black, heavily Democratic counties. In Mississippi, they fringe the western edge of the state, as you can see. These are solid 60-40 and 70-30 Democratic areas, and we have every reason to expect they could be even stronger, or at least a higher percentage of turnout, then in previous years. The problem for Democrats is, uh, the rest of the state, which is pretty grim. pale blue counties are 15-20 point defeats, while the deep red are 75-25 Republican counties. A further problem for Democrats is that the deep red counties are in whole, larger than the deep blue counties. Overall, the main story is that a Democrat needs at least 25% of the white vote to win the state, and that is pretty unlikely generally.
But there are some special notes to the special election. There is no party identification, only names. This is good for Musgrove's commercials, where not mentioning the D-word will only be a benefit with white voters, but given that he was a Democratic governor, he can't really hide his party that well. Also, I've wondered how this will play overall. While Musgrove will pick up low-info white voters who may not vote Democratic, but like him, and don't get the reminder of a D, will this be canceled out by the opposite from Black low-info Obama voters? Considering a similar proportion of voters are probably low-info in both demographics, it may give a slight edge to Musgrove, but not much.
Counties to watch: Looking at Musgrove's 1999 Gubernatorial win, and his 2003 loss, the difference is pretty simple, winning the northeast corner of the state. In 1999, the two corner counties, white Alcorn and pale red Tishomingo, along with the two white counties on the eastern border, Lowndes and Monroe, all went to Musgrove, along with some of their neighbours. In 2003, he lost these to Haley Barbour, and the state went with them. You'd have to think that to win this time around, he'd need to repeat the same thing. The two white counties at the dead centre of the state, Attala and Leake, are pretty solid bellwethers, and worth watching to see Musgrove's progress.
MS-01 is the northern part of the state, taking the area that is basically between the state border and a diagonal line connecting the northwest corner and the two eastern swing counties talked about above. When SSP previewed this race in May for the special election, they noted that Davis is from Memphis, and that was a bit of a negative for a lot of other areas in Mississippi proper. Childers looks pretty safe for re-election, but he'll need to build margin in the two blue counties in his district, Benton and Marshall.
Where the people are: The blue county labelled 8.03 in the east of the state, along with the counties around it, make up the capital, Jackson, with around 15% of the vote. In the far south, the Gulfport-Biloxi is a red stronghold with around 10%. Finally, in the northwest corner, a deep red county is DeSoto, part of the Memphis metro area.
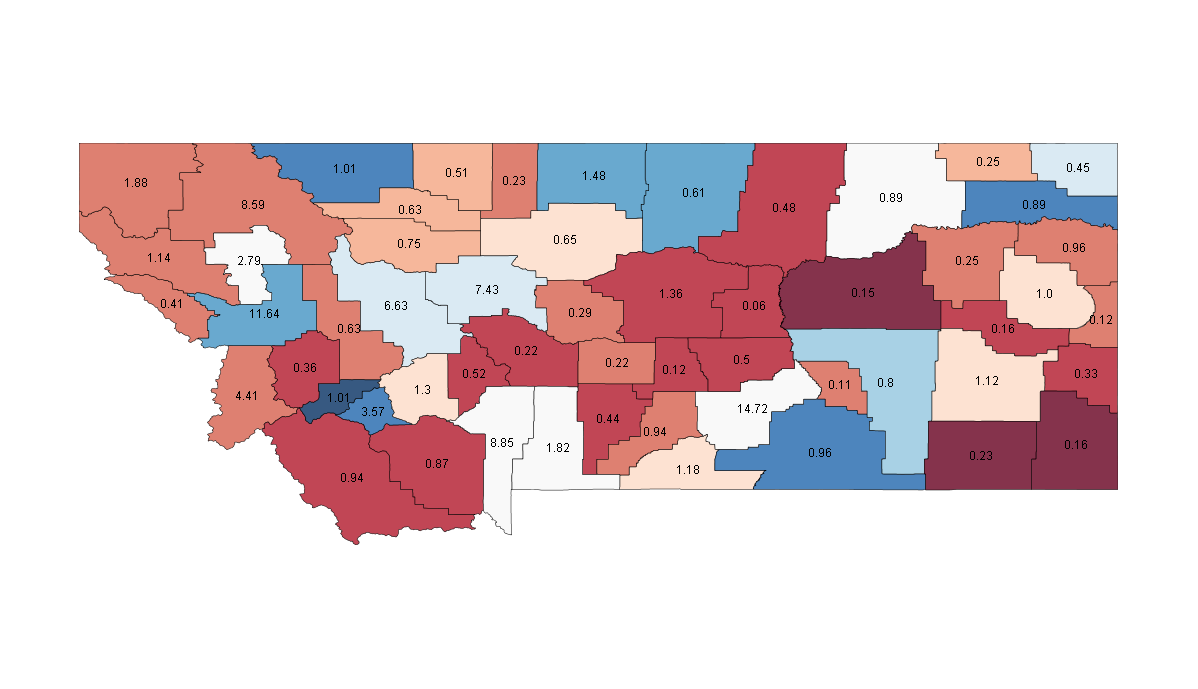
MONTANA
This page includes a map of county names
Races (538 Average/SSP Rating): President - Likely McCain (O 47.1, M 51.3) Senate - Safe Democratic (D 66.0, R 31.1) House - Not close
The only real question in this race is presidential, as the house and senate seats, along with the governor's mansion, are solidly Democratic. It's a state with a large independent streak, as it had the largest percentage of Perot votes in the country in 1992, which allowed Clinton to win it, the first Democrat since LBJ. Obama is polling just behind, but how does he take and win it? Probably the way Jon Tester did, which mirrors this map well.
Democrats are strong in Missoula in the west, home of the University of Montana, along with Butte, just southeast of Missoula. Another key area of strength is the aboriginal vote, as four of the five blue counties on the state's borders are majority aboriginal counties. If Obama can win these 60-40, or better, he may have a good night in the state. The brick and deep red counties are very tough ground for Democrats, many of these are 75-20 Gore/Kerry counties or worse, and the Republicans are solid in the fairly populous northwestern part of the state.
Counties to watch: Two of the three largest counties in the state are very close swing counties, and in both Tester was near even with Conrad Burns. These are Gallatin, on the southern border and projecting south into Wyoming, home to Bozeman, and Yellowstone County the central white county forming a barrier between a deep blue and a deep red, which is Billings. Keeping it even here will allow Missoula, Butte and the reserves to push Obama over the top.
Where the people are: Even in Montana, Democrats win where the people are. Billings and the surrounding area are around 17% of the vote, Missoula and environs around 17% also. Flathead county, just north of Missoula, has another 9%, while Butte has around 5% and Bozeman around 10%.
NEBRASKA
This page includes a map of county names

Races (538 Average/SSP Rating): President - Likely McCain (O 41.7, M 57.5) Senate - Safe Republican (D 42.4, R 54.7) House - NE-02, Esch v. Terry(i) (Lean R)
Since 1964, the best showing from a Democratic candidate was 38% and 4 counties for Carter in 1976, but without any recent polls, it's tough to say if Obama can improve on this. In any case, if he wins four, they look like they would be Lancaster, Saline, Thurston and Dakota, one of which Kerry won, and all four of which Gore had within double digits. The CDs are marked on the map for the allocation of electoral votes, but Obama will have to be closer to down by 10, rather than 15, to have a realistic shot at flipping the most favourable, NE-02, which is contained entirely within Douglas County, Omaha. Note that NE-02 also contains the fabelled "Obama/Terry" voter that congressman Lee Terry says will stop Jim Esch from taking his seat. I suspect Esch will need McCain/Esch voters more than Terry will need Obama/Terry voters, though.
O2B Senate candidate Scott Kleeb is down by pretty wide margins as well, and will find it difficult to get back. If he does, he will take the Democratic "Nelson/Kerrey route", winning most of the eastern edge, the 'tree' of pale red and white counties at the eastern edge of the third congressional district, and the two white counties in the western area.
Counties to watch: Both Ben Nelson and Bob Kerrey won without the easternmost lone white square, Lincoln County (not the city of Lincoln), but they both did win the western one, Box Butte County. Both are nearly 65-35 Bush counties twice, meaning it is not great Democratic ground. The other area to watch are the white coloured counties flanking Omaha, such as Dodge, Saunders and Cass. If these are red, Kleeb's hopes are surely sunk. If Omaha itself is red, as the polling now would suggest it's just on the cusp of, it'll be a double-digit loss.
Where the people are: Two small and blue counties in the east, along with their white and pale red surrounding areas make up more than 50% of the vote. These are Omaha on the eastern border, and Lancaster County, just to the southwest of Omaha, home of Lincoln and the University of Nebraska.
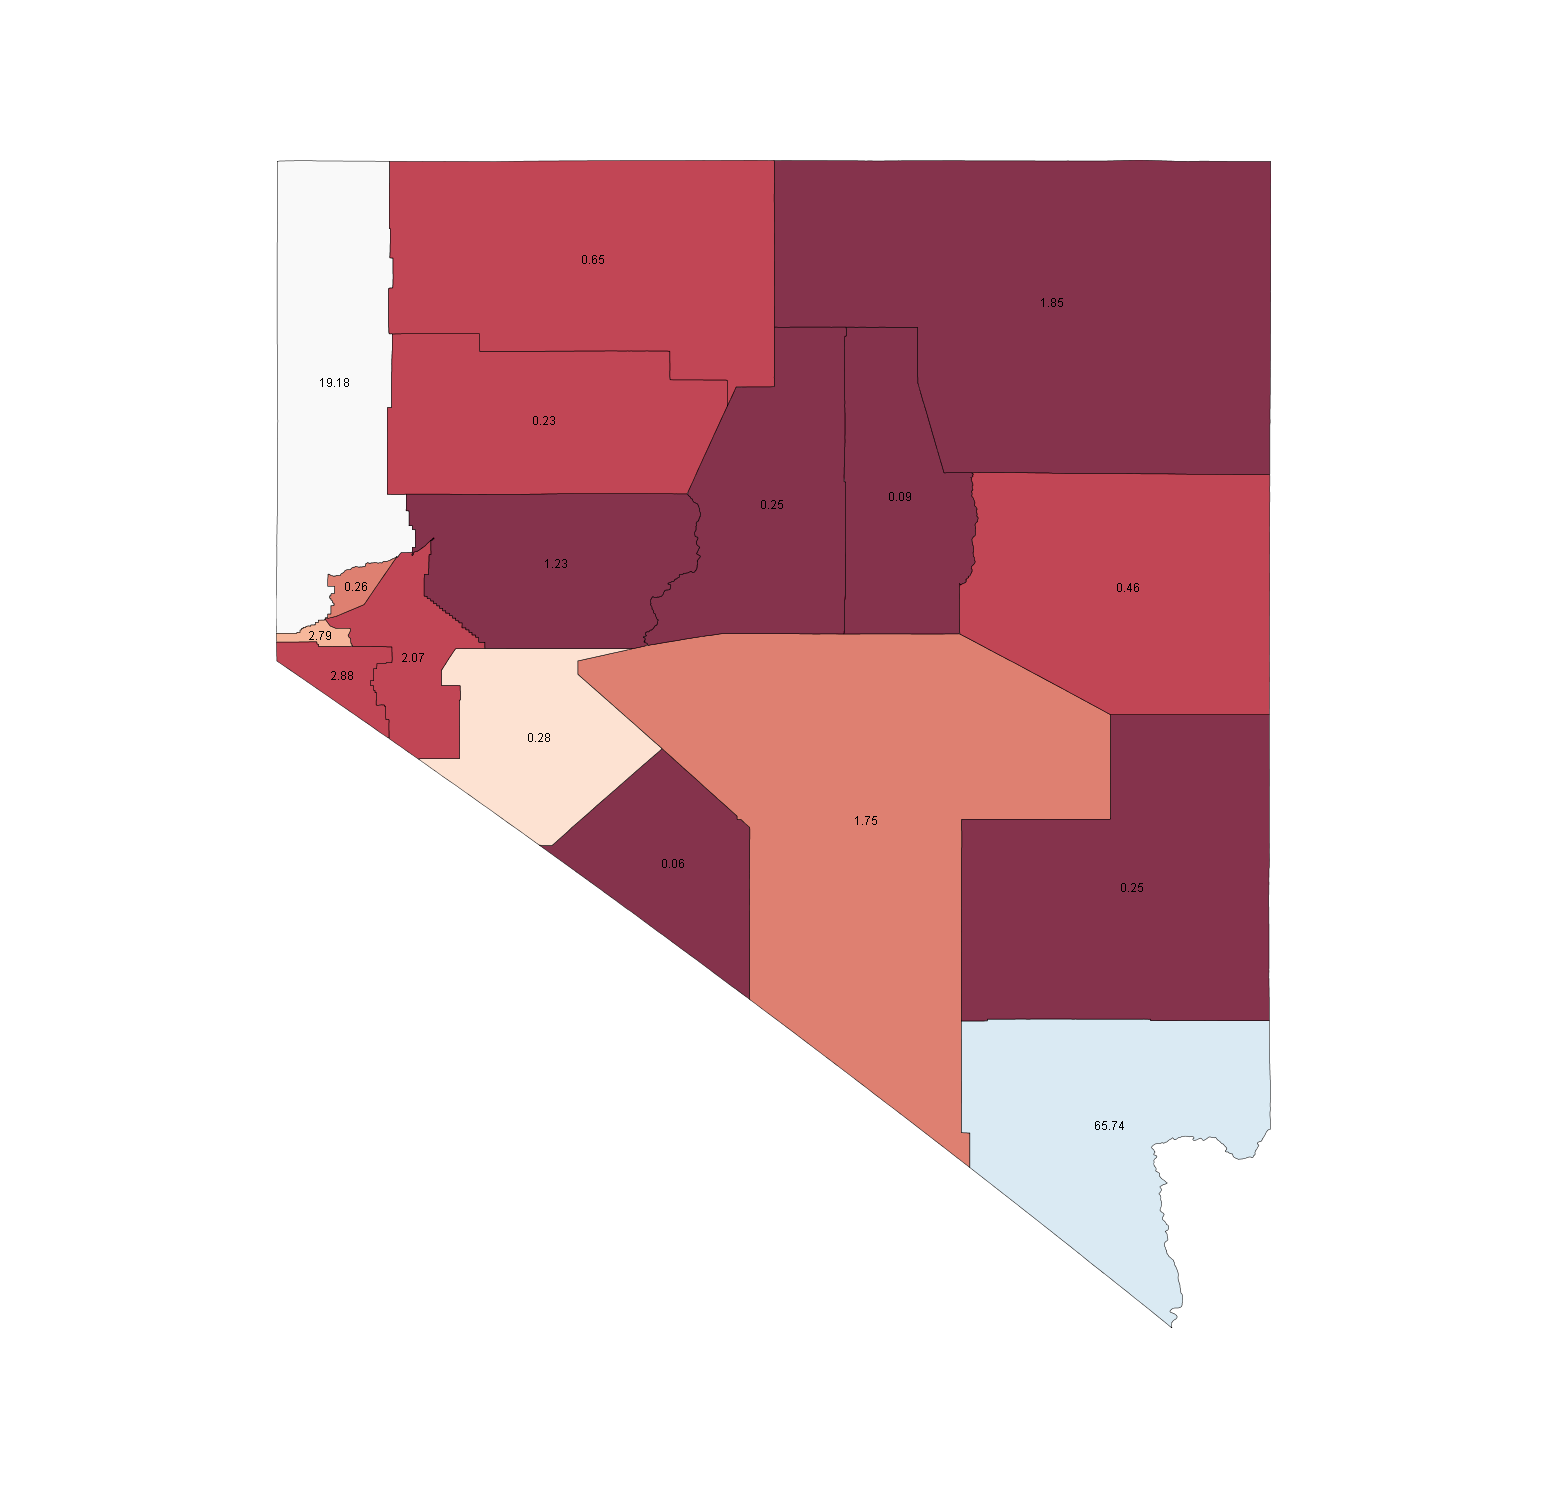
NEVADA
This page includes a map of county names
Races (538 Average/SSP Rating): President - Likely Obama (O 51.0, M 47.7) Senate - None House - NV-02, Derby v. Heller(i) (Lean R), NV-03, Titus v. Porter(i) (Toss-up)
If you're a night owl like myself, or a west coaster, you may have been following Higher Pie's early voting diary on the state of Nevada. From his diary, a note of the import of Nevada's counties.
Why just Clark and Washoe?
87% of Nevada's registered voters live in Clark+Washoe. The other 13% are very red, but if Obama can carry ~53+% of Clark+Washoe, he'll win Nevada.
I couldn't have put it better and more succinctly than that. Clark County in the southeast has more than 65% of votes, but still tends to be around 4 points favourable for the Democrat, showing the other 35% is quite red. Another nearly 20% of this is the western white county, Washoe, though this tends to run a little behind the Democrat across the state, though it is trending blue. Much of the rest of the state is either 70-30 or 75-25 Bush counties, with Carson City, the small light red county south of Washoe and Nye county, the large light red on the southwest border, and home to the controversially proposed Yucca Mountain nuclear waste site, as the most notable exceptions.
Counties to watch: Unlike in neighboring Arizona, where a Democrat can closely lose Maricopa county and still win, in Nevada there is no margin for error. Obama must win Clark County, probably by at least 4 points, and keep the margin at worst even in Washoe, to carry the state. A tie or loss in Clark will be give John McCain the electoral votes. The other counties are not really consistent enough to the state average to be bellwethers.
There are two interesting congressional races. NV-03 has Dina Titus trying to win a Clark County district that does not include Las Vegas proper, but stretches out from the centre of the county like a three petaled flower, reaching the southern, eastern and western edges. But spare a thought for Jill Derby, who is racing for NV-02, which is the entire non Clark County part of the state, plus part of Clark County. Harsh. This is a heavily Republican area, but even here, there is a dominant county, as the Washoe and Clark County areas of the district contain more than 50% of the voters. Washoe will be the main focus for Derby to take the seat, which is certainly a possibility.
Where the people are: Washoe is Reno, Clark is Las Vegas. That's where they are.
NEW HAMPSHIRE
This page includes a map of county names

Races (538 Average/SSP Rating): President - Safe Obama (O 53.2, M 44.9) Senate - Likely Democratic (D 52.5, R 44.9) House - NH-01, Shea-Porter(i) v. Bradley (Lean D)
This is the one 'safe' state that I wouldn't be surprised to see end up a little closer than expected, if only because of its recent history of close finishes and Obama's primary loss. I think Obama will win, but it might be closer to 5 points than double digits.
Still, Obama should sweep all the counties in the state but one, Belknap, a 55-45 Bush county in both '00 and '04. This includes the strongest Democratic county, Cheshire in the Southwest, a 60-40 Kerry county. In an oddity for Democrats, the two largest counties in the state, Hillsborough and Rockingham in the southeast, both went to Bush even as Kerry and Gore won overall.
Jean Shaheen looks pretty safe against John Sununu, and should be able to win the rematch of the 2002 race. In that race, Shaheen lost the two biggest counties by 8 and 12 points, respectively, and still only lost the state by 4.
Counties to watch: The two white counties right at the south centre of the state are fairly swingy. Hillsborough, the southern and larger one, runs about a point or two behind the Democratic candidate, while Merrimack, the northern one, runs a point or two ahead. If Obama and Shaheen win both, they should take the state fairly comfortably, while if they split them, they will have to hold the margins close in Hillsborough.
NH-01 covers the most Republican area in the state, the southeast corner, including the majority of all three red counties, along with light blue Strafford, but despite this, it looks like Carol Shea-Porter, who took the seat by 5000 votes, will win her rematch with much more ease this time. If it's close Shea-Porter will hope to have Strafford's votes all but cancel out any Republican margin in the two northern red counties, then manage to win in Hillsborough.
Where the people are: In the southeast, Manchester and Nashua are in Hillsborough County, while Rockingham has a lot of people, but mostly from many smaller areas. Concord sits in the other swing county I highlighted, Merriamack.
NEW JERSEY
This page includes a map of county names
Races (538 Average/SSP Rating): President - Safe Obama (O 56.1, M 42.0) Senate - Safe Democratic (D 56.7, R 40.0) House - NJ-03, Adler v. Myers (Toss-up), NJ-05, Shulman v. Garrett(i) (Likely R), NJ-07, Stender v. Lance (Toss-up)
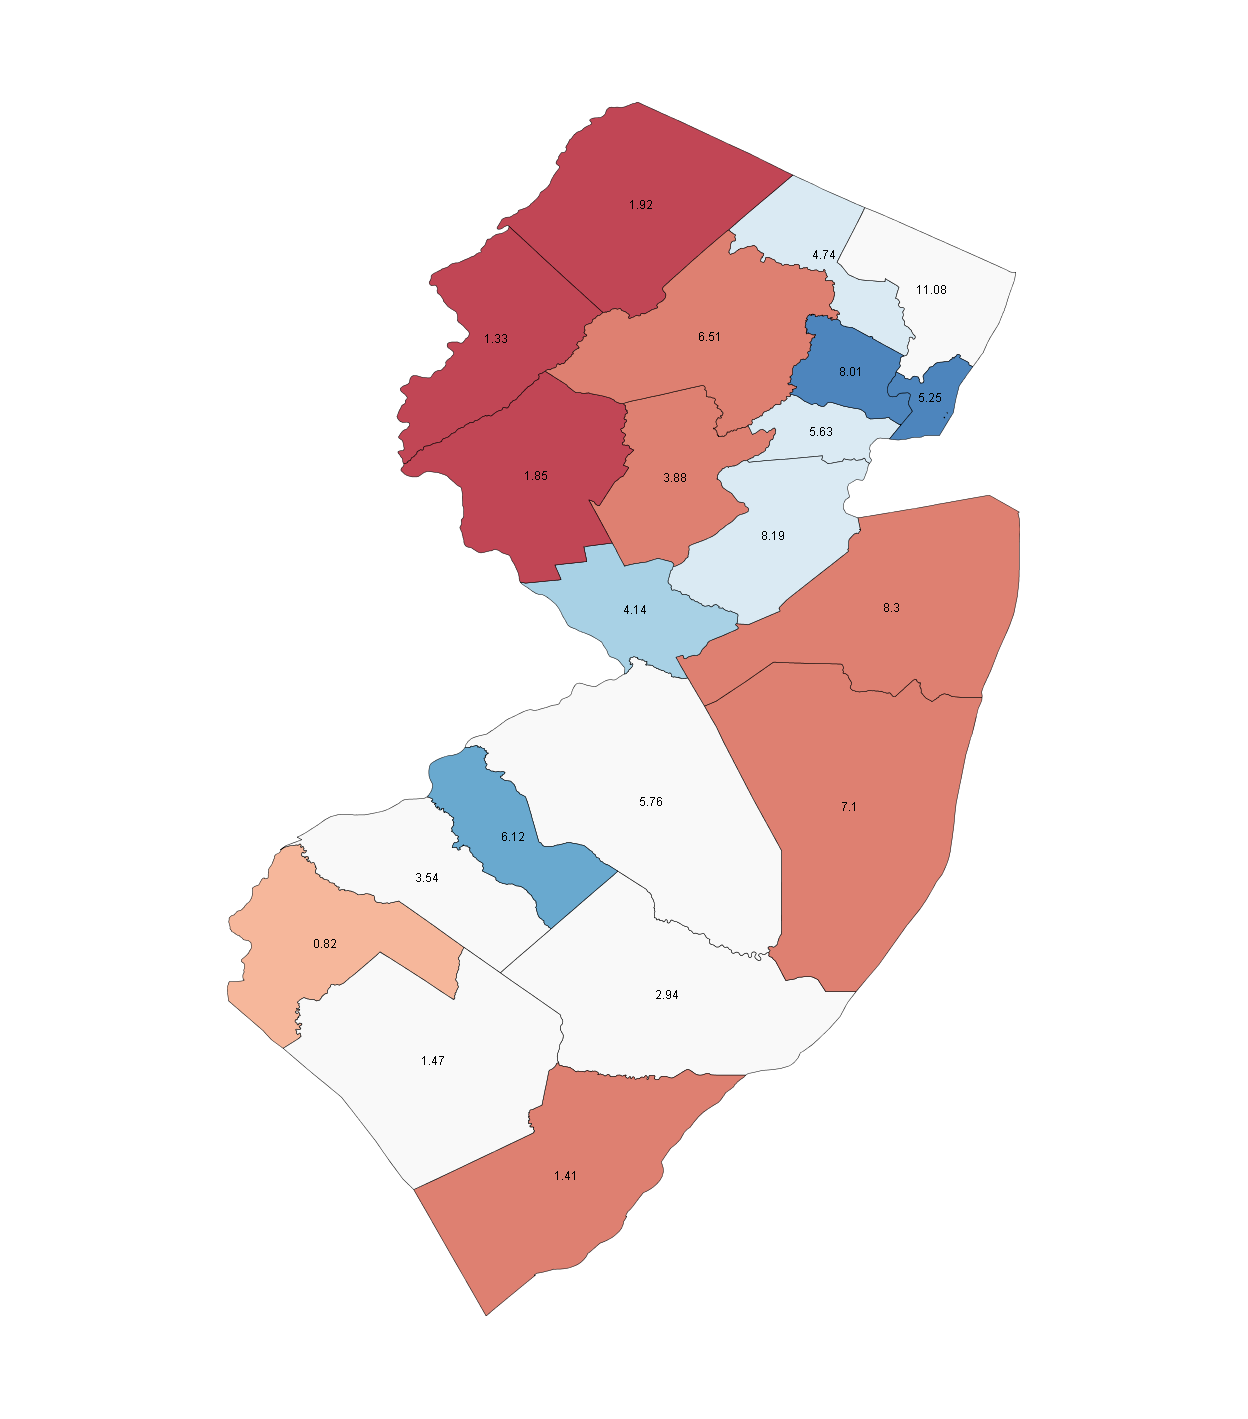
New Jersey was a 16 point Gore state, and a 6 point Kerry state, but their maps differ by only one county. Corzine in 2005, Menendez in 2004 and Lautenberg in 2002 all also won with the same map as Gore, showing a 10-15 point win is basically the same for all Democrats in the state. The map follows the white and blue counties diagonally southwest from the northeast corner, stretching the length of the state. With a 14 point and a 16 point lead respectively, Obama and Lautenberg will take all the blue and white counties, as well as flipping the one pale red county, Salem.
A really large win, though, could flip the whole Southern half of the state, though this didn't even happen for Gore. The three northeastern counties are blood-red, but they're really just 60-40 Bush counties in a 55-45 Democratic state. In many states, they'd be considered a good area for Democrats.
Counties to watch: OK, so not too much drama in the state-wide results, but if you want to see how things are going, watch Bergen County, the white county in the northeast, as it is usually within a point of the overall state result.
O2B candidate Dennis Shulman, a blind rabbi and teacher, is a progressive hope for NJ-05. This contains the bulk of the two northernmost red counties, Sussex and Warren. The good news for Shulman is the district curls around the northern elbow of the state, and also gets parts of more friendly Bergen and light blue Passaic county. Two open seats are also interesting, the NJ-03 challenge of John Adler, where NJ-03 is a bow-tie shaped district that straddles the southern red county on the eastern edge of the state, Ocean, and the white county beside it, Burlington, and a challenge for NJ-07 from Linda Stender. NJ-07 covers most of the red areas in the north that NJ-05 does not, but snakes into pale blue Union and Middlesex counties, where Stender will try to build a win.
Where the people are: All of the large counties along the northeastern border are part of the New York metro area, which contains more than 2/3 of the state's votes. The same can be said of the southwestern border and Philadelphia, and that area contains a further 15% of the vote.
NEW MEXICO
This page includes a map of county names
Races (538 Average/SSP Rating): President - Safe Obama (O 53.3, M 45.5) Senate - Safe Democratic (D 58.1, R 39.9) House - NM-01, Heinrich v. White (Lean D), NM-02, Teague v. Tinsley (Toss-up)
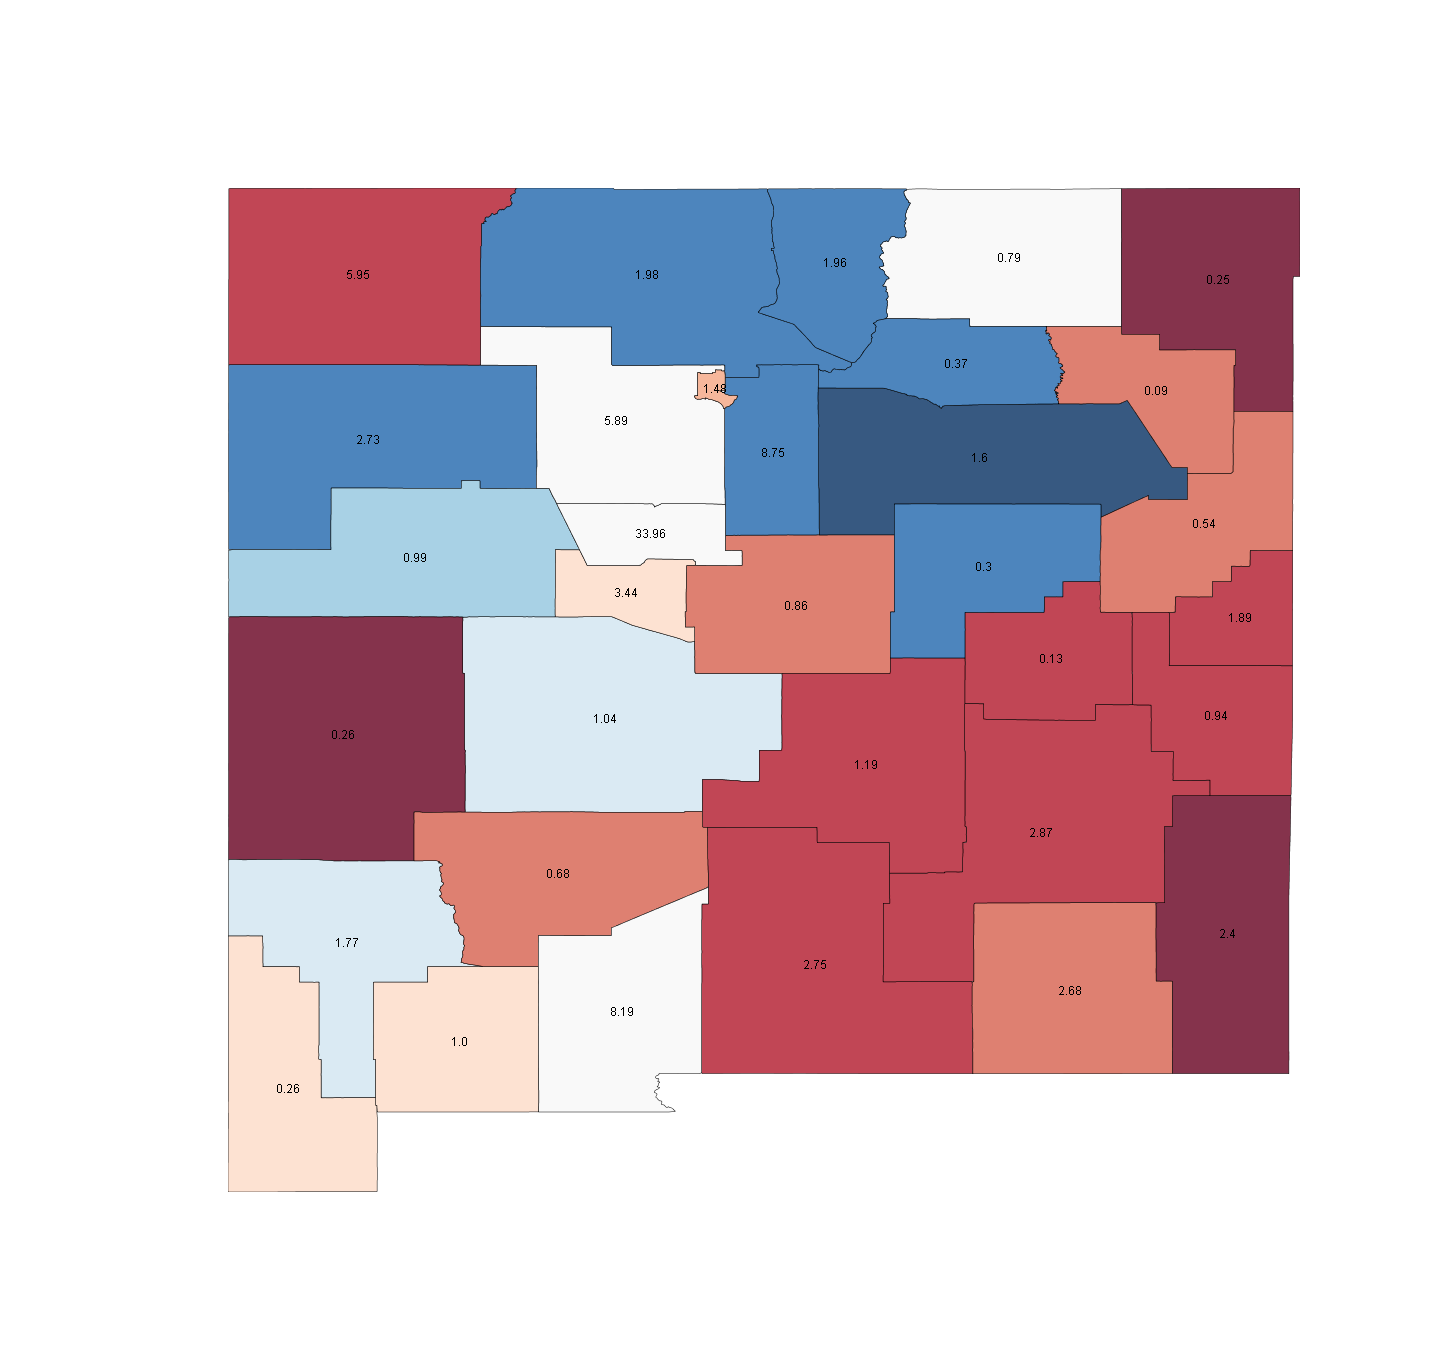
It was looking, in July and August, like this could be a key, close race. Now, with Obama up double digits in several recent polls, it looks pretty clearly Democratic. New Mexico contains an interesting mix of Hispanic and Aboriginal people, and with both groups favouring Democrats, this creates a strong correlative link. Only three red counties, Chaves and Lee in the southeastern corner and Harding, the pale red 0.09 in the northeast, are more than 40% Hispanic, and the only blue counties with less than that number are McKinley and Cibola, dark and light blue, respectively on the northeastern border. These two counties have 70% and 40% Aboriginal voters, respectively.
New Mexico has had it's brush with close elections, and when it was close, the action was mostly in the two central white counties, Bernalillo and Sandoval, covering the Albquerque area.
Counties to watch: It's gotta be those two I just mentioned, but they should be at least a 5 or 6 point Obama/Udall spread this time around. Doña Ana county in the south will also be just a bit ahead of state average and is worth watching to see if a race develops.
Two good house races, as all three incumbents decided to run for the senate seat Tom Udall is going to win. Udall's old NM-03 is safe Democratic as it stretches across the north and contains all but one of the darker blue counties. NM-01 is also favourable as a seat for Dem Martin Heinrich to take over, with much of Bernalillo County falling in it's small area. Even though this is a swing area, the state going so Democratic will make it easier for Heinrich. The tough district is for Harry Teague, NM-02, basically everything south of Albuquerque. Teague has some light blue areas in the west, but these are dwarfed by the size of the vote in the dark red votes in the east. He'll need to win Doña Ana, as well as holding at least a couple of those eastern red areas close, perhaps Eddy County, containing Carlsbad Caverns, or Chaves County, with Roswell, will be able to keep him in it.
Where the people are: More than 50% of the vote comes from Albuquerque and Santa Fe, which are close together, Albuquerque in the central white county, and Santa Fe in the blue directly east. Las Cruces lies in Doña Ana County, which has another nearly 10% of votes.
NEW YORK
This page includes a map of county names
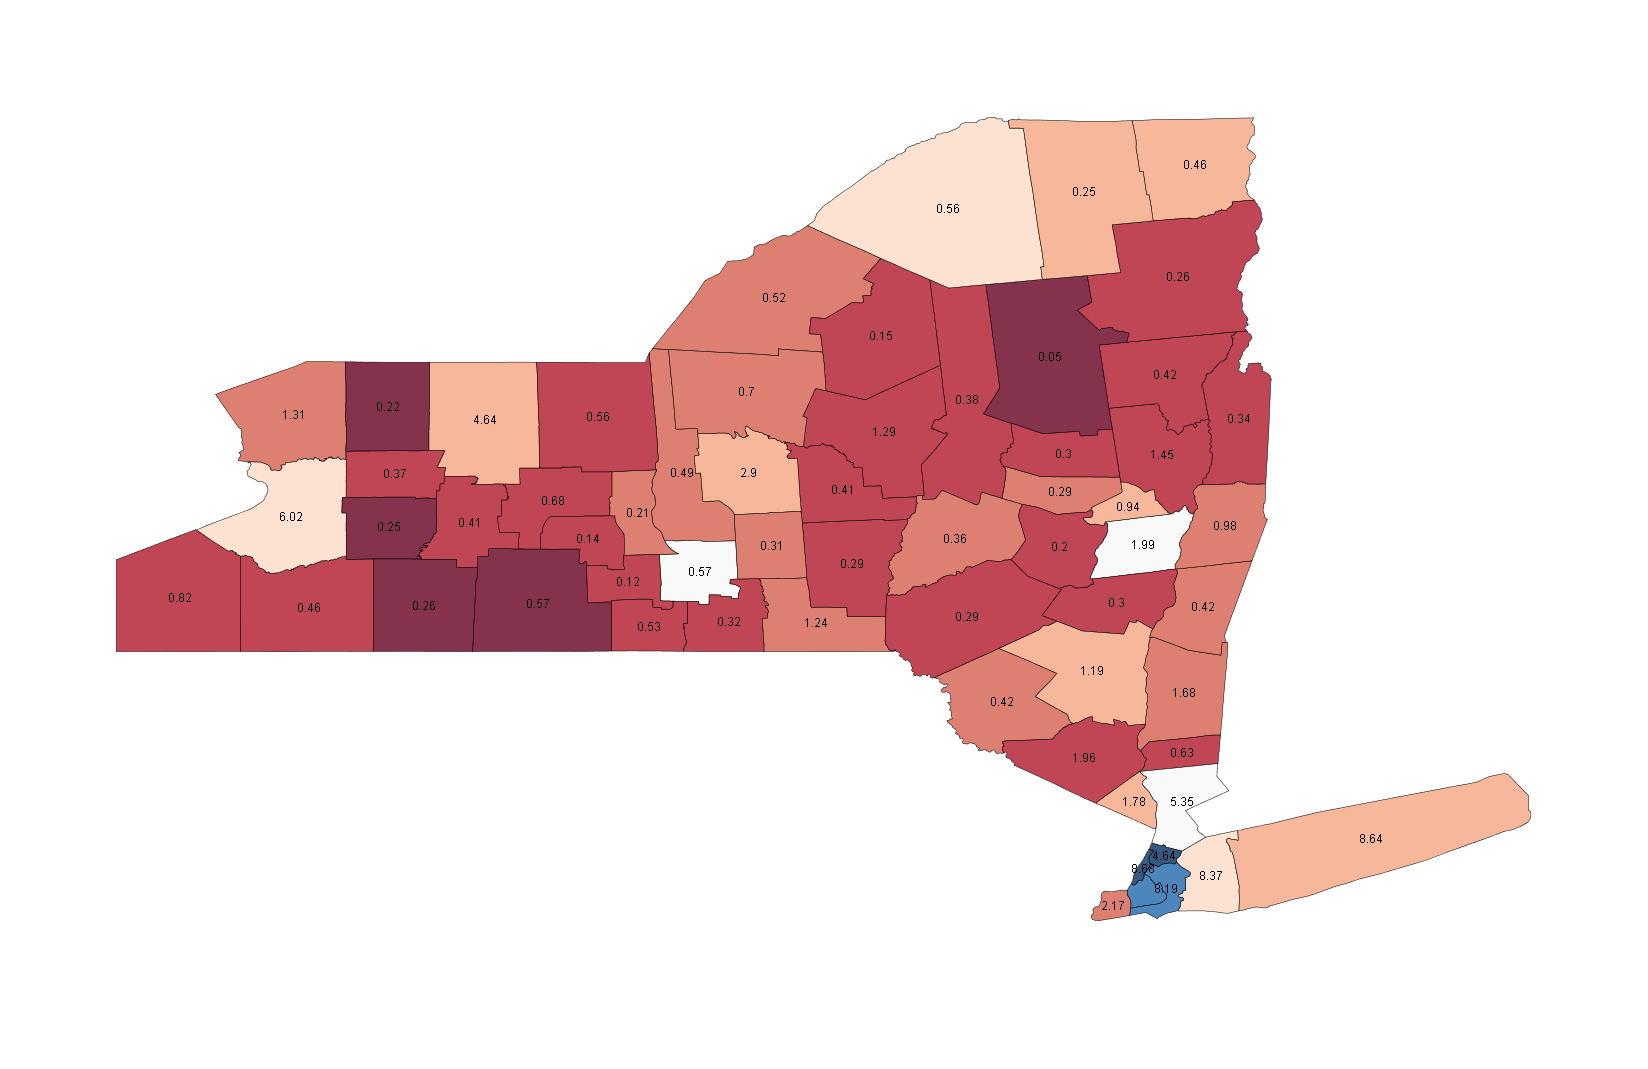
**Note that, again, the census maps don't like islands, so they look like one big land mass**
Races (538 Average/SSP Rating): President - Safe Obama (O 62.2, M 36.5) Senate - House - NY-13, McMahon v. Straniere (Safe D), NY-20, Gillibrand(i) v. Treadwell (Lean D) NY-25, Maffei v. Sweetland (Likely D), NY-26, Krzyan v. Lee (Lean R), NY-29, Massa v. Kuhl(i) (Lean D)
A Democrat could probably win New York with 7 counties, but don't need to, as the pale red counties typically vote Democratic, just not by as wide a margin. Still, the really Democratic counties are so small you can hardly see them, but the two northern darker ones, New York and Bronx Counties, are typically 80-20 Democratic, while the lighter blue, Kings and Queens, are closer to 75-25. A bit of a problem with all these maps is that an area like Erie, the pale red on the western edge, containing Buffalo, typically goes 55-35 Democratic, enough short of state average to be red. As usual, the problem for Republicans is that their dark red counties just don't have many people in them.
This will be a huge blowout for Obama, with some polls showing McCain struggling to break 30% (!) To put this in perspective, a recent Mason-Dixon Utah poll had that race closer than 4 of the last 5 polls of New York. The question is not if he'll win, but whether it'll be Gore 2000 or Clinton 2006.
Counties to watch: The race across the state won't be close, but watch the two white counties in the east, Albany County the northern one and Westchester just outside NYC, as these should give you an idea of the overall margin.
No less than 5 interesting house races will keep us watching the Empire State, though. NY-13 has all kinds of crazy shenanigans, between current seat holder Vito Fossella getting a DWI and admitting he fathered a child from an affair, and Republican challenger Straniere seeming like he might be removed from the ticket and replaced with Fossella, and having his hot dog plant close during the economic crisis. It all adds up to a Democratic gain in Staten Island, the farthest west part of New York City.
Kirsten Gillibrand looks like she can hold NY-20, a district that stretches most of the way up the eastern edge of the state. Her strong area will likely be the pale red counties just north of the New York area, Dutchess, Rensselaer and Columbia, all of which were close Bush-Kerry counties. NY-25 could be a pickup, the district starts in the northwestern part of the state, just where the northern border stops sloping south, and extending east into the state interior to the pale red county labelled '2.9', Onondaga County, Syracuse, where most of the district's votes are. NY-26 is a tougher road, just at the western edge of the state, including the northern part of pale-red Erie, and most of the deep-red districts just east of Erie. In this district, Erie and Monroe, Buffalo and Rochester, are only partially included, but they should be more Democratic. NY-29 is the last district, featuring O2B candidate Eric Massa. Massa has a tough district but a good chance, as his district includes the deep red counties on the southern border of the state, Allegany and Steuben, and stretches north through the eastern brick-red counties to the southern edge of the Rochester area. The northern parts will probably be stronger for Massa. There's not a ton of polling here, but we do know that the Republican once threatened his ex-wife with two shotguns, and now brags about owning nine (!). Massa is a good candidate who should have a good chance of a pickup.
Where the people are: the boroughs of New York City itself have around 1/3 of the state-wide vote, with Long Island having a further 17%, so just about 50% of votes come from the southeast of the state. The Buffalo area has around 6%, while the Rochester area has around 4%.
Thanks for reading, I'll be back tomorrow with part 4